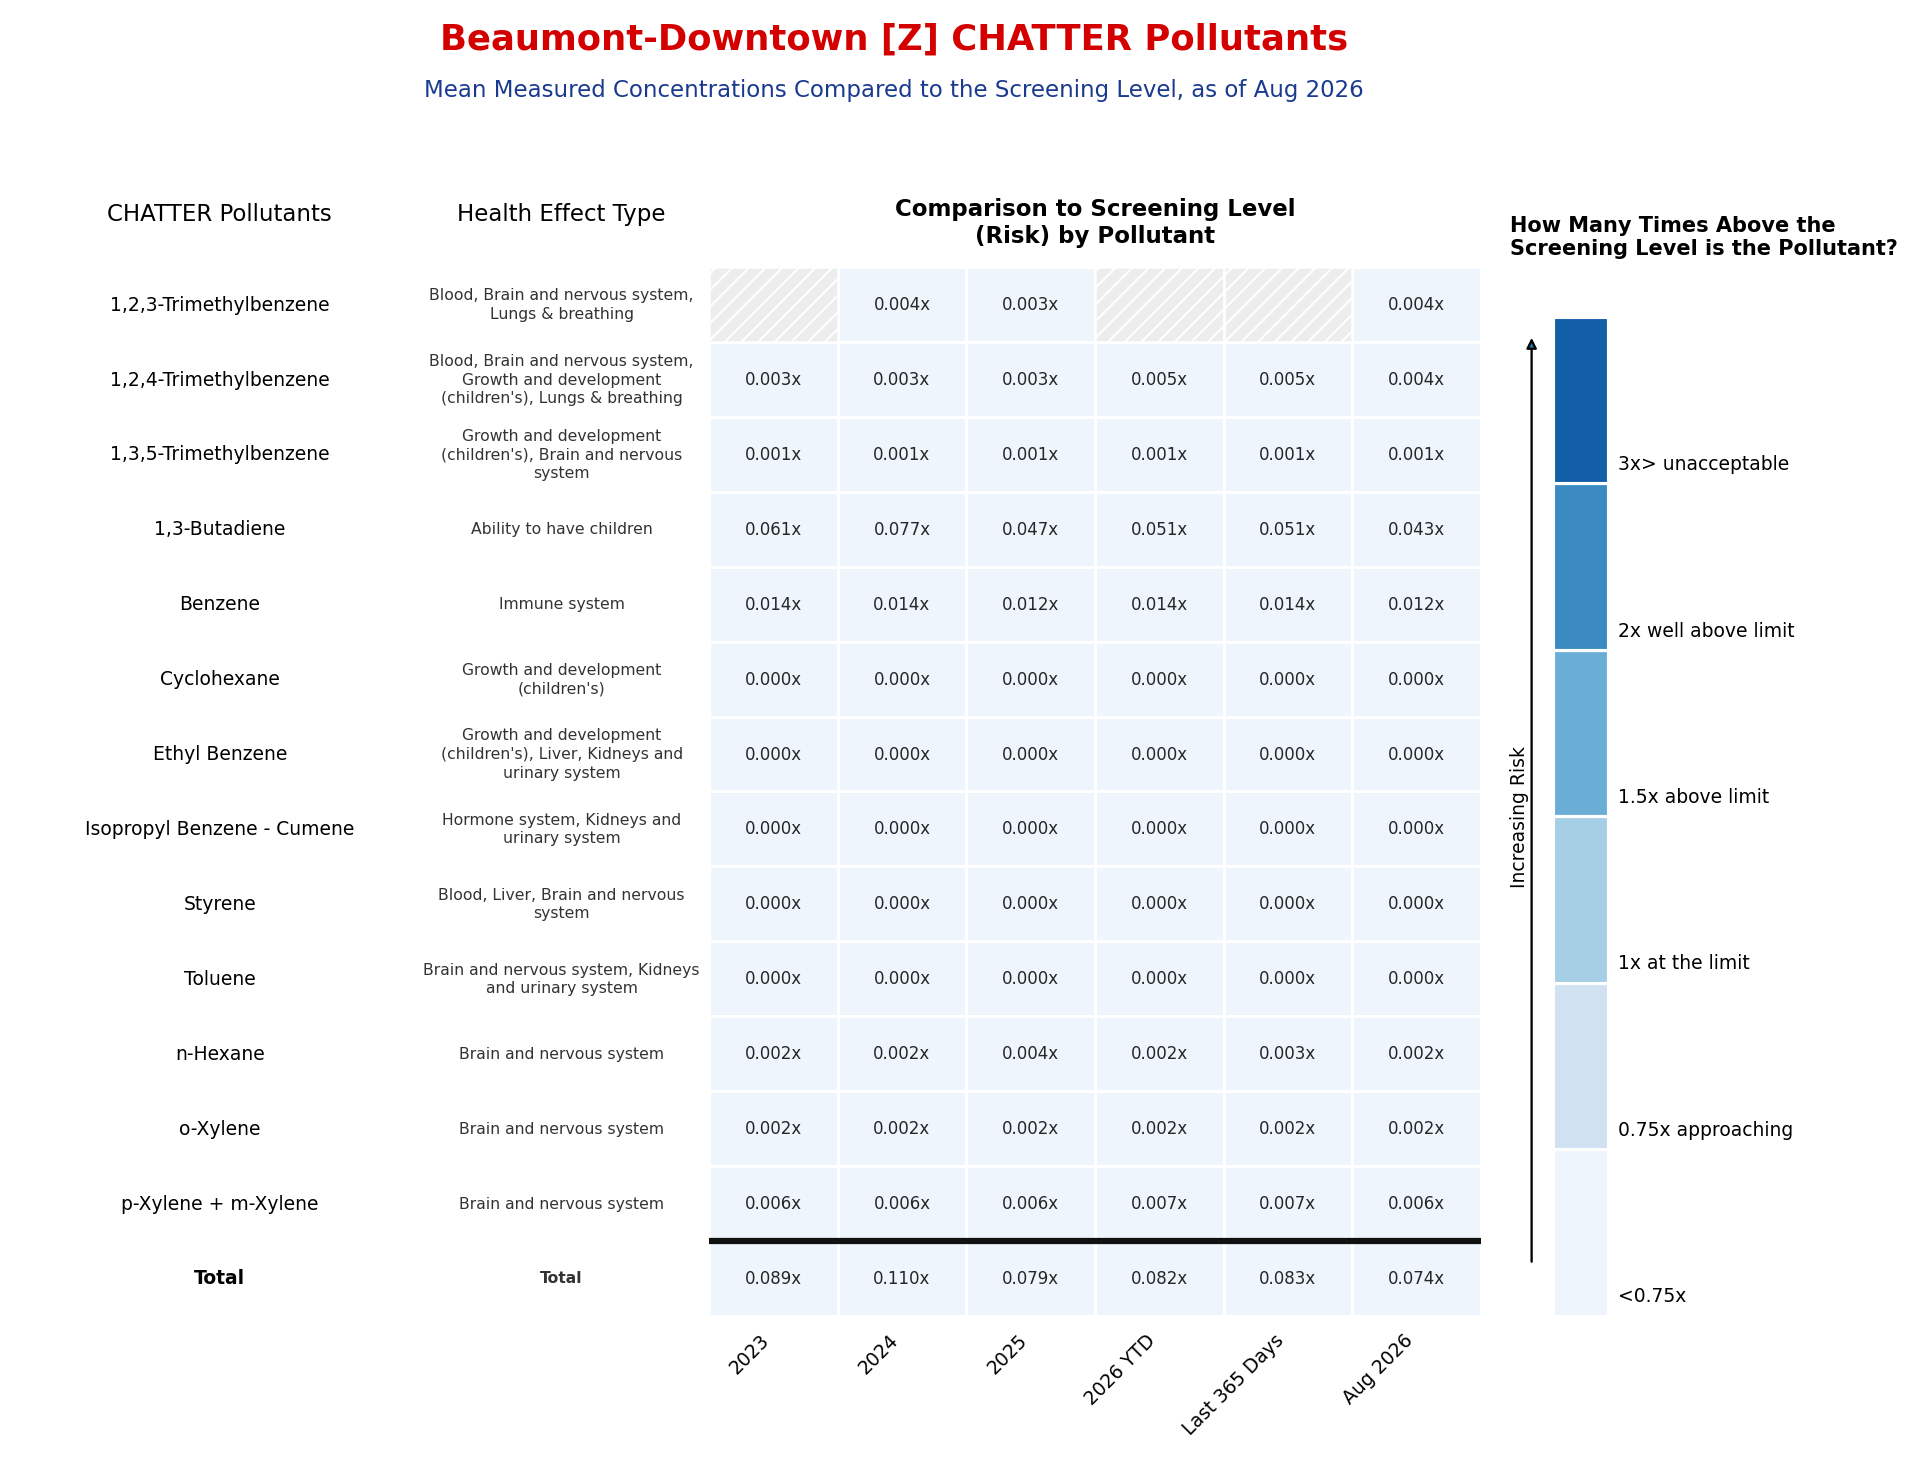
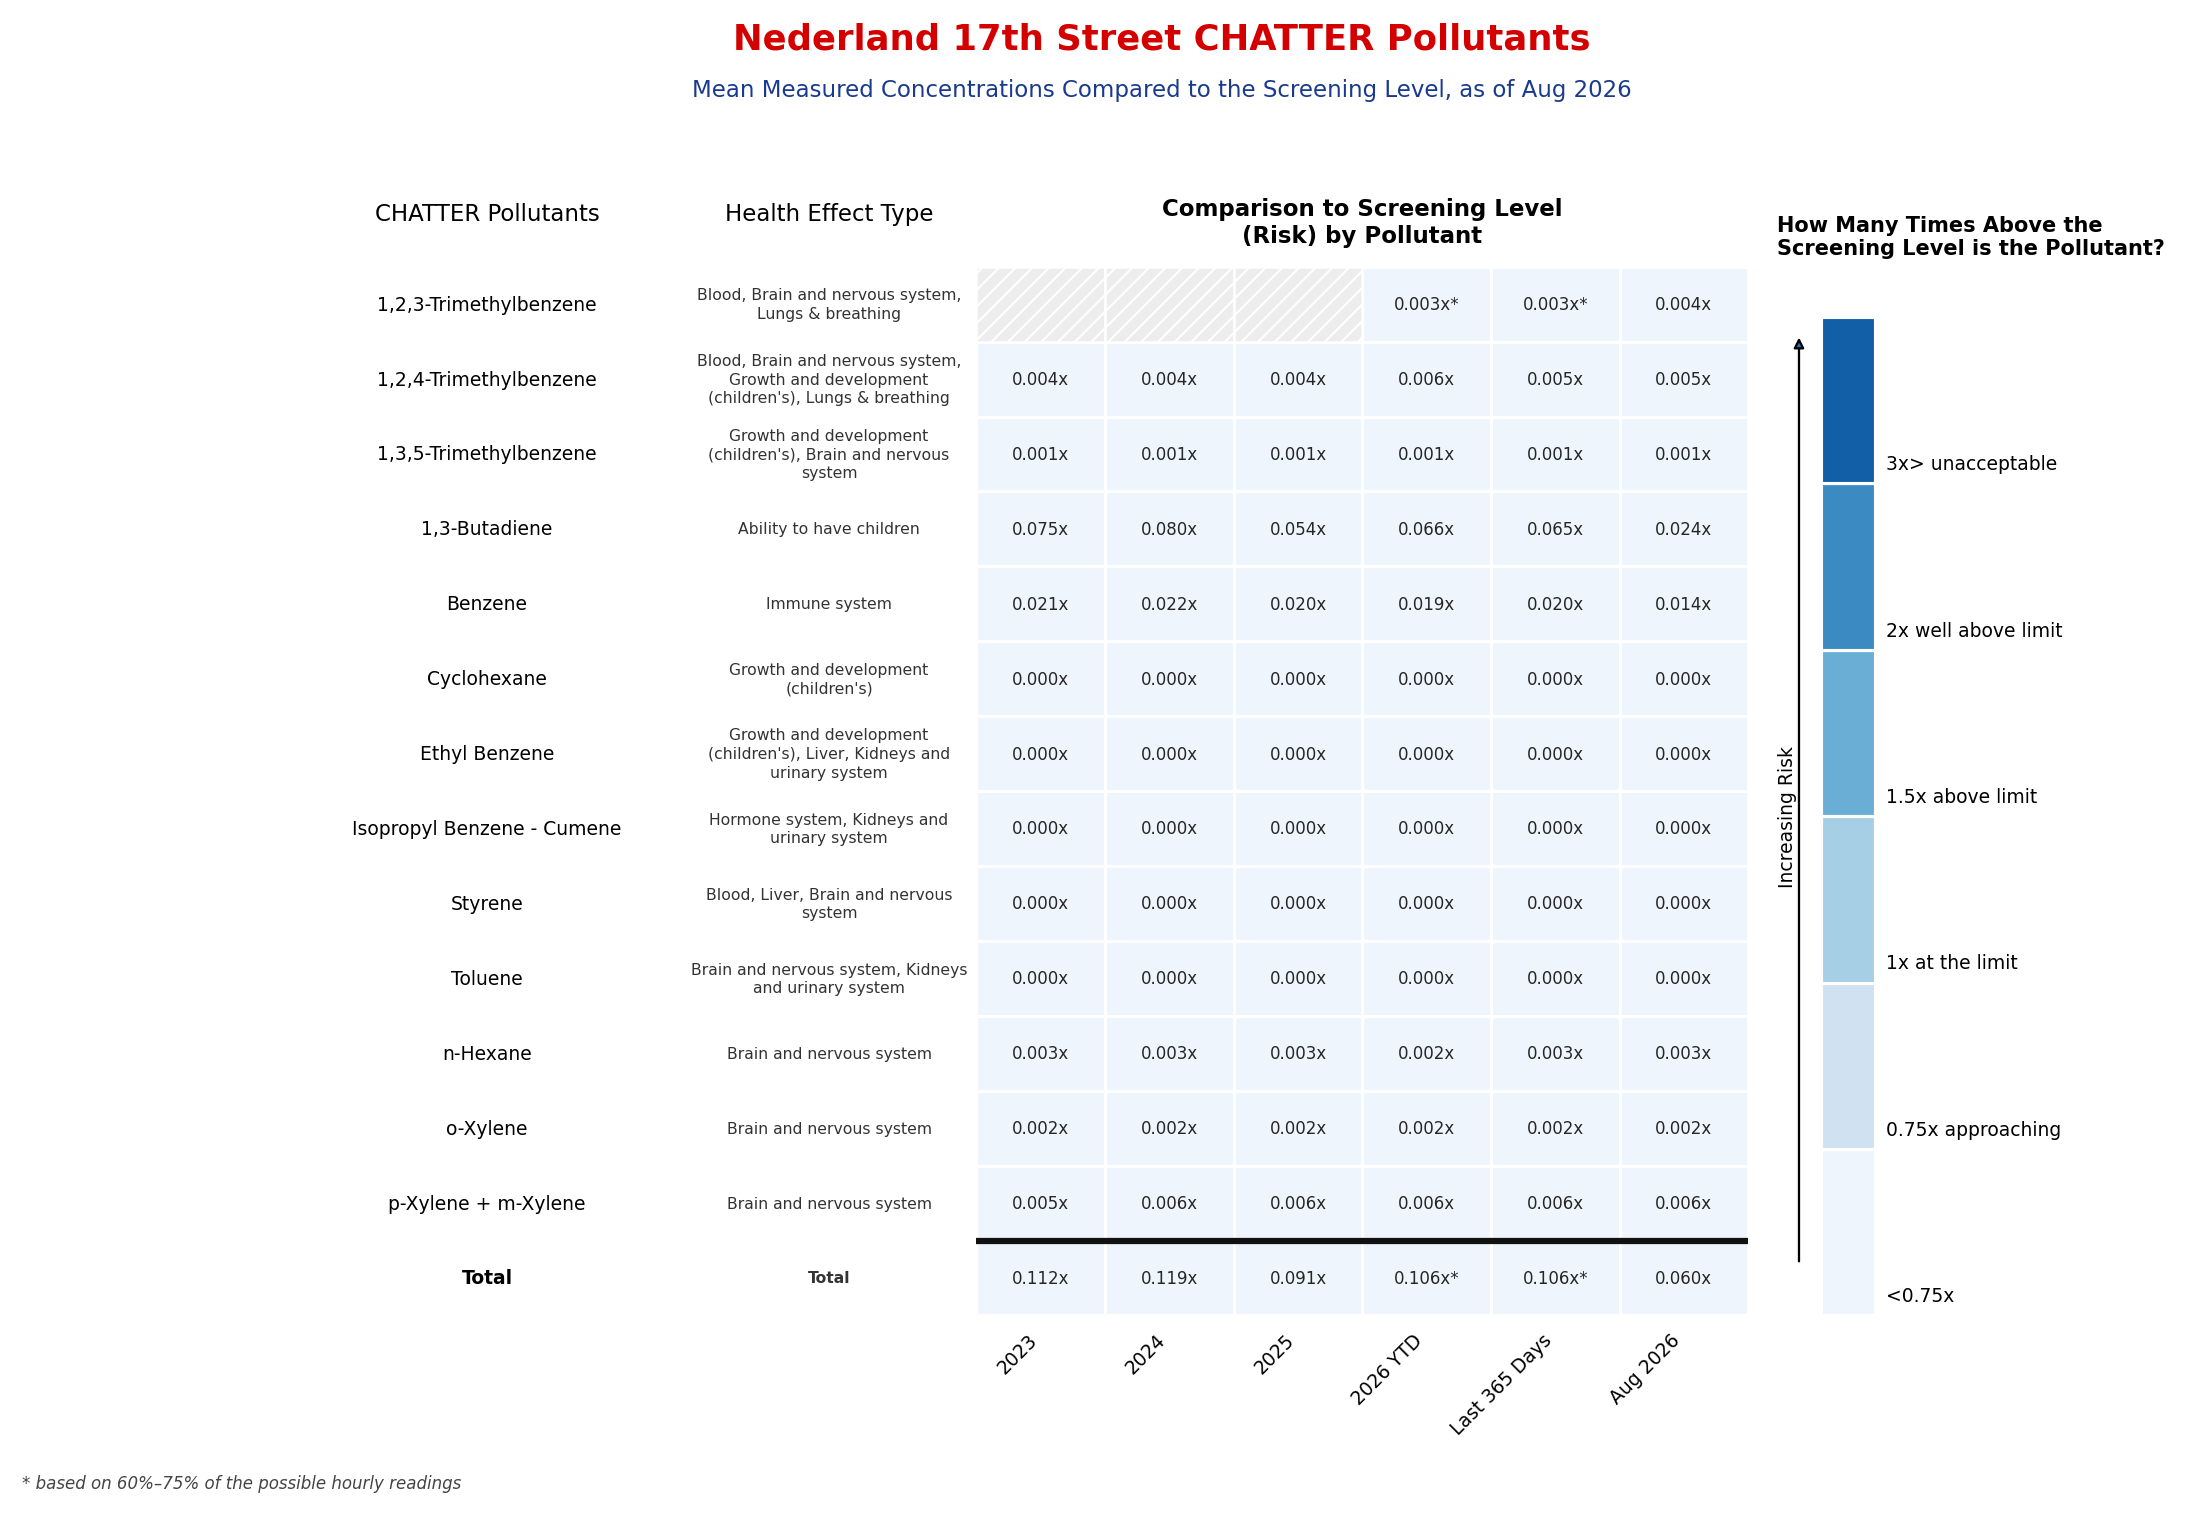
Each location card lists every other-health-risk pollutant measured at that site, the health effects each one is associated with, and its risk over time — the average concentration divided by the screening level. A value below 1.00x is below the screening level; 1.00x is the screening level itself. The bottom Total row adds those ratios across all pollutants at that site, the same “Total” definition used on the main dashboard.
CHATTER analyzes air pollutants measured with automatic gas chromatograph (AutoGC) equipment. In Beaumont-Port-Arthur, there are only two AutoGC monitor sites that measure cancer risk pollutants analyzed by CHATTER: Beaumont-Downtown and Nederland 17th Street. Hatched gray cells mean no measurement exists for that pollutant in that period.
How to read this plot (click to expand)
Each row is an air pollutant, with the health system or target organ it is associated with listed beside it. Each column is a period of time. The bottom row, Total, adds all the pollutants together for that period. The number in each square is the measured level divided by the EPA screening level, written as a multiple with an “x.”
A clarifying example.On the Nederland 17th Street card, find the row for Benzene and the column for 2024. The square reads 0.022x. The health effect listed beside benzene is Immune system, meaning breathing benzene at high enough levels can affect the immune system. The number means the average benzene level in 2024 was about 2% of the screening level — well below it. In the same column, the Total row reads 0.119x: even adding all thirteen pollutants together, the combined level was about an eighth of the screening level.
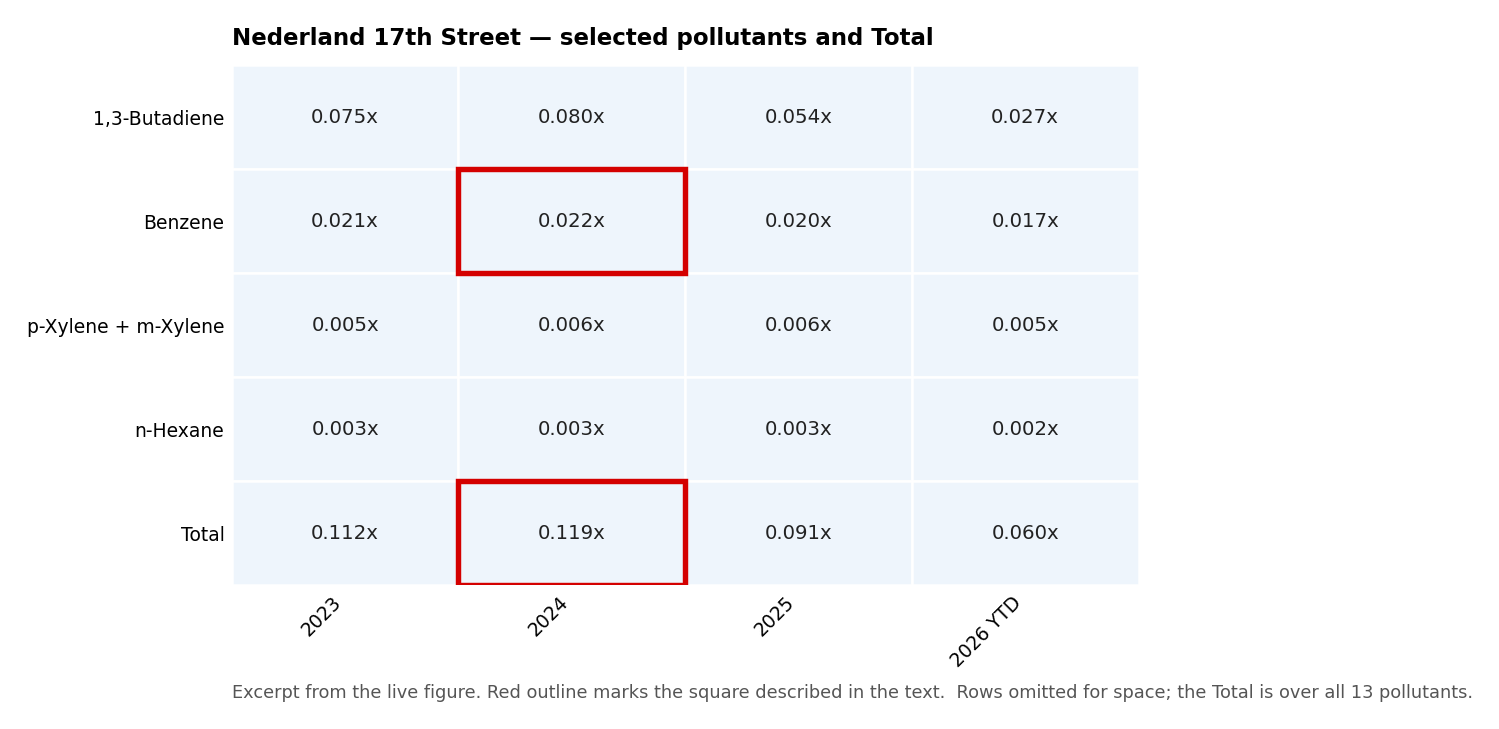
Everything on this tab is currently below the screening level. The color scale does not begin to darken until 1.00x, and the highest value here is about 0.119x, so the whole grid appears in the palest shade. That is the finding, not a rendering problem. Read the numbers to compare pollutants, sites, and years.
Hatched gray squares mean the pollutant was not measured in that period — which is different from a low reading, and so is marked differently.
For a general explanation of heat maps, see the Frequently Asked Questions.