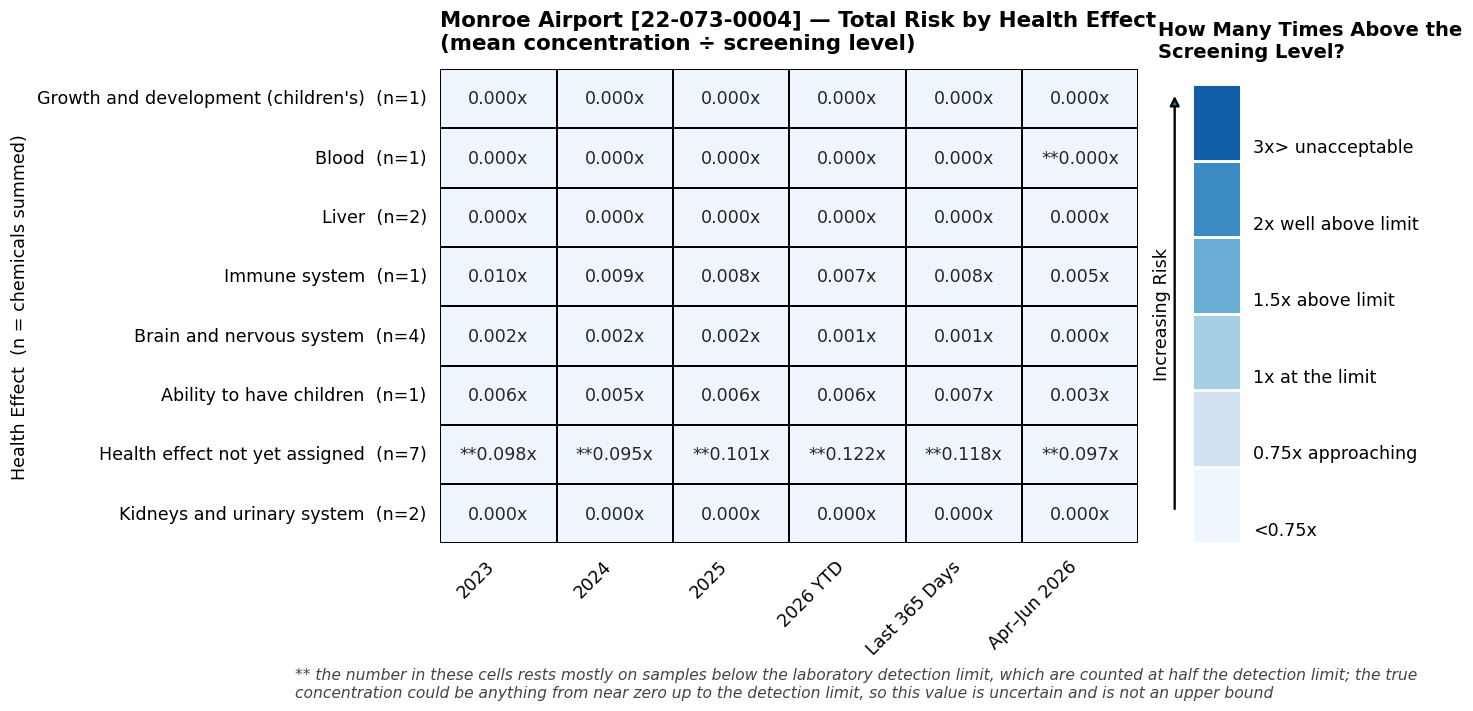
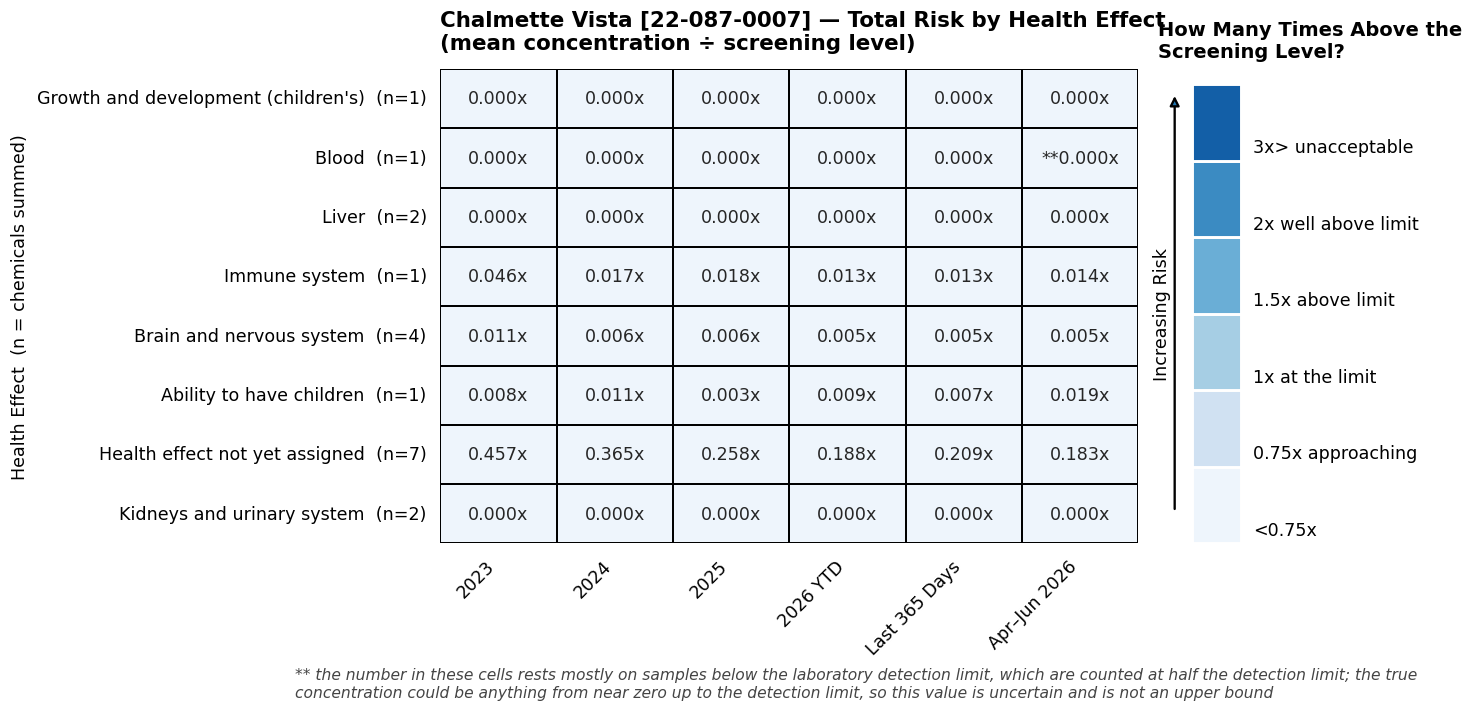
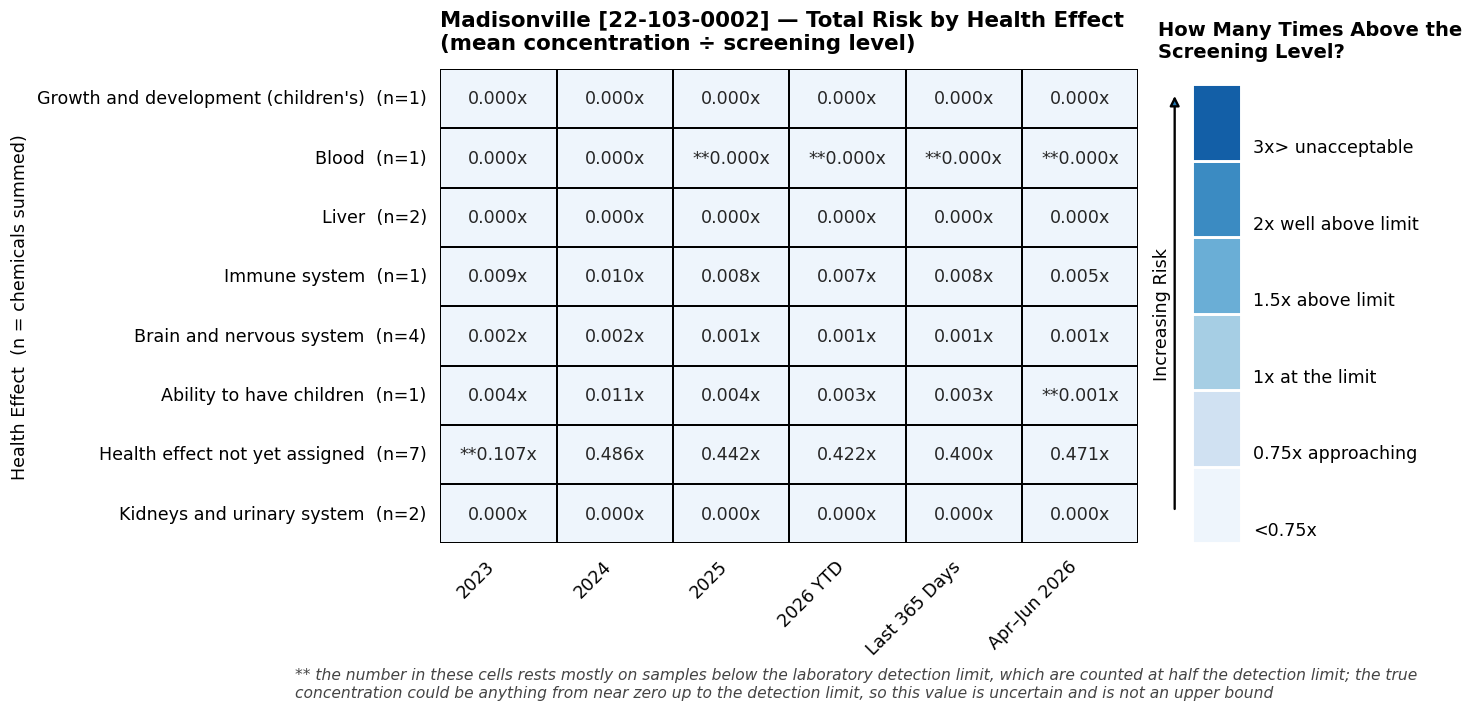
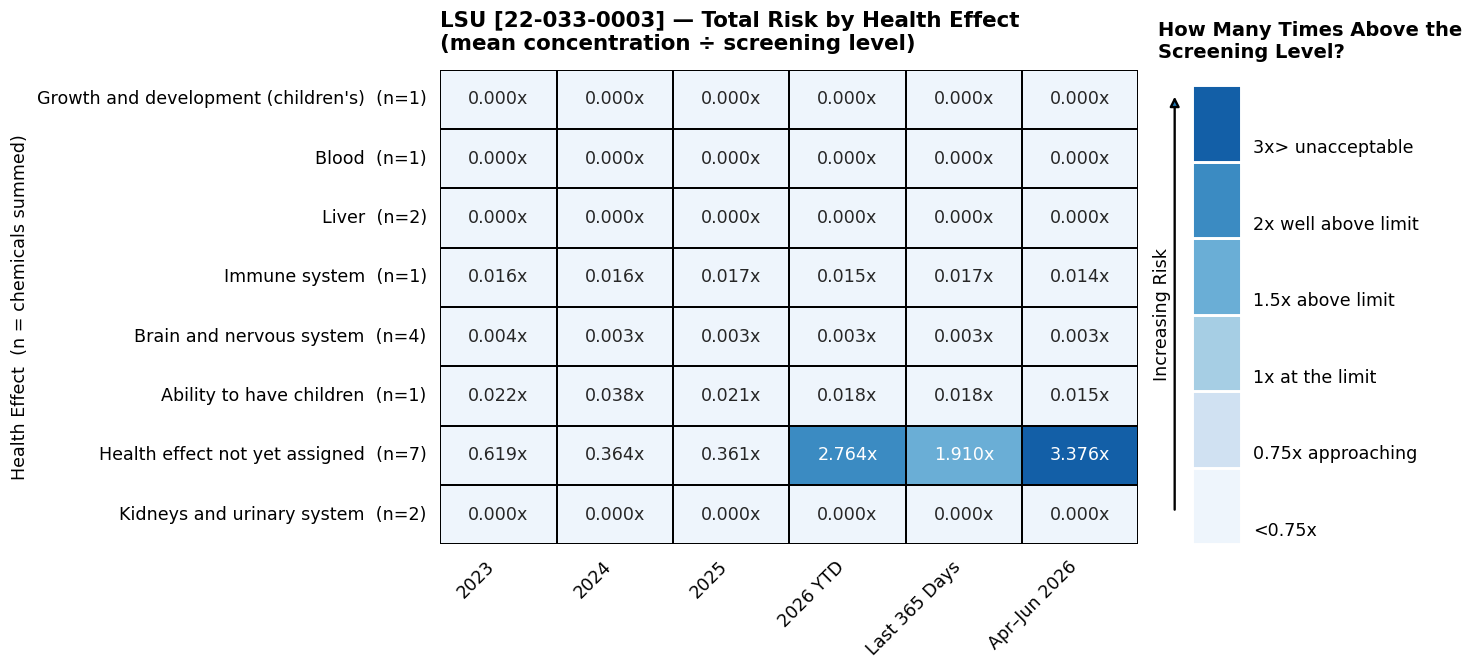
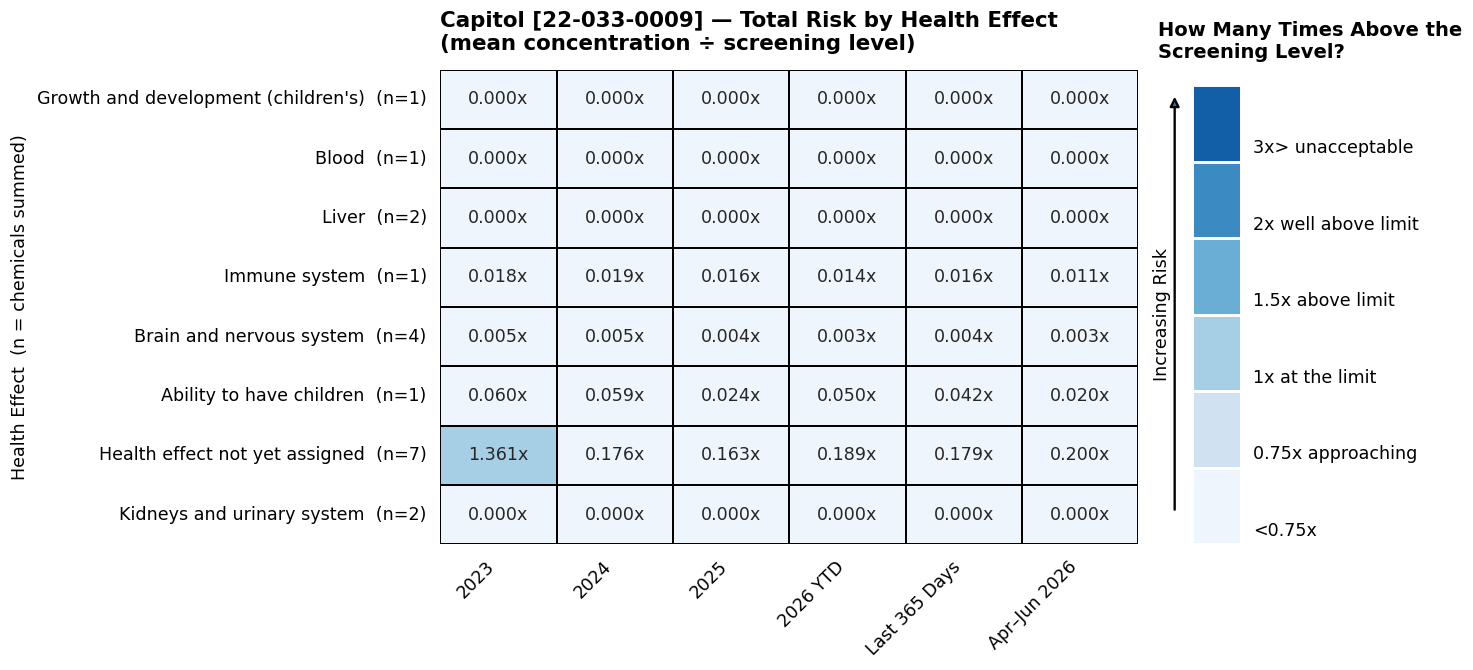
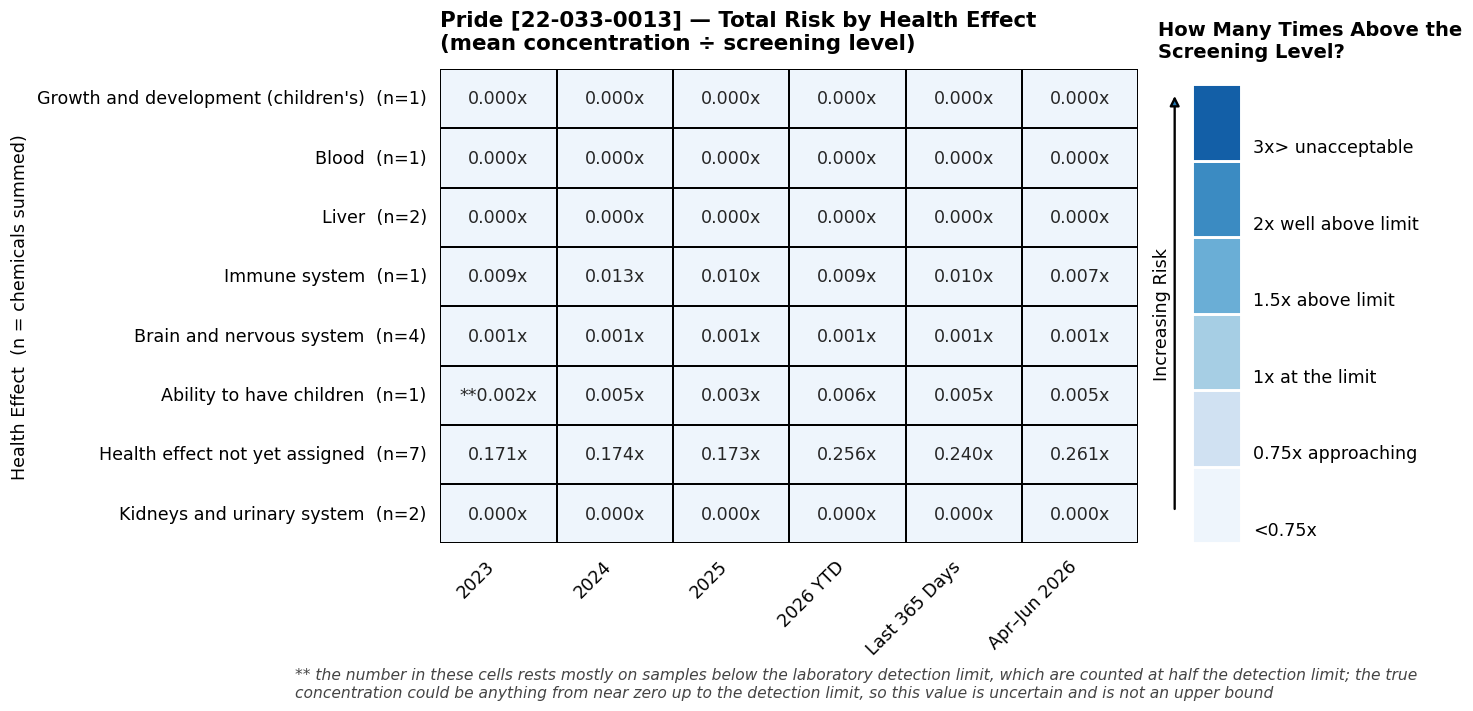
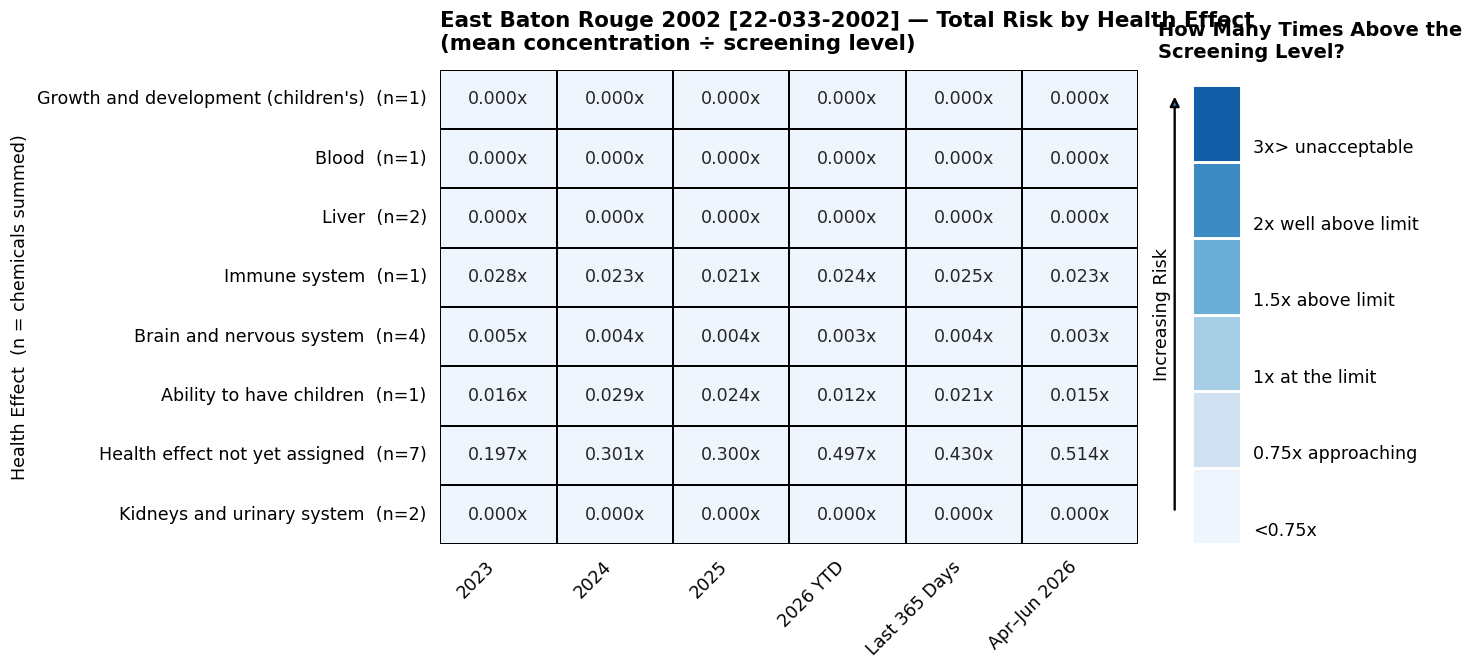
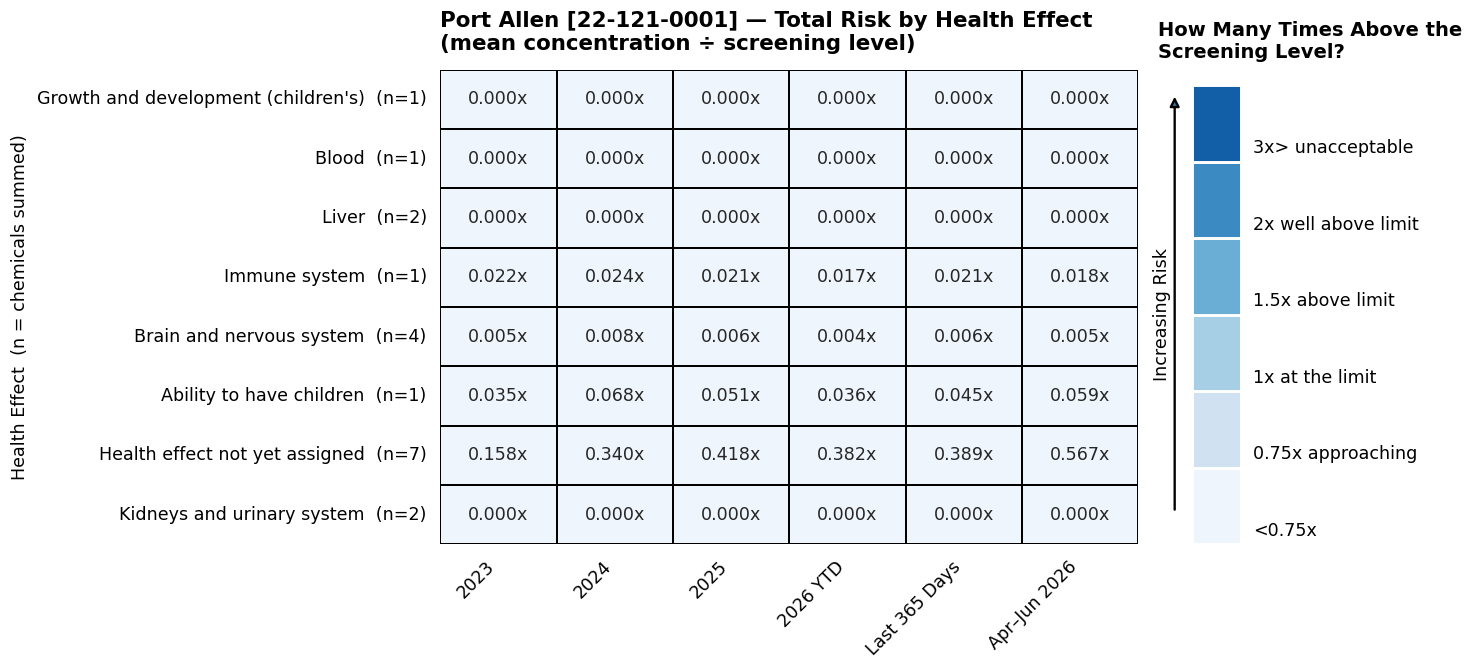
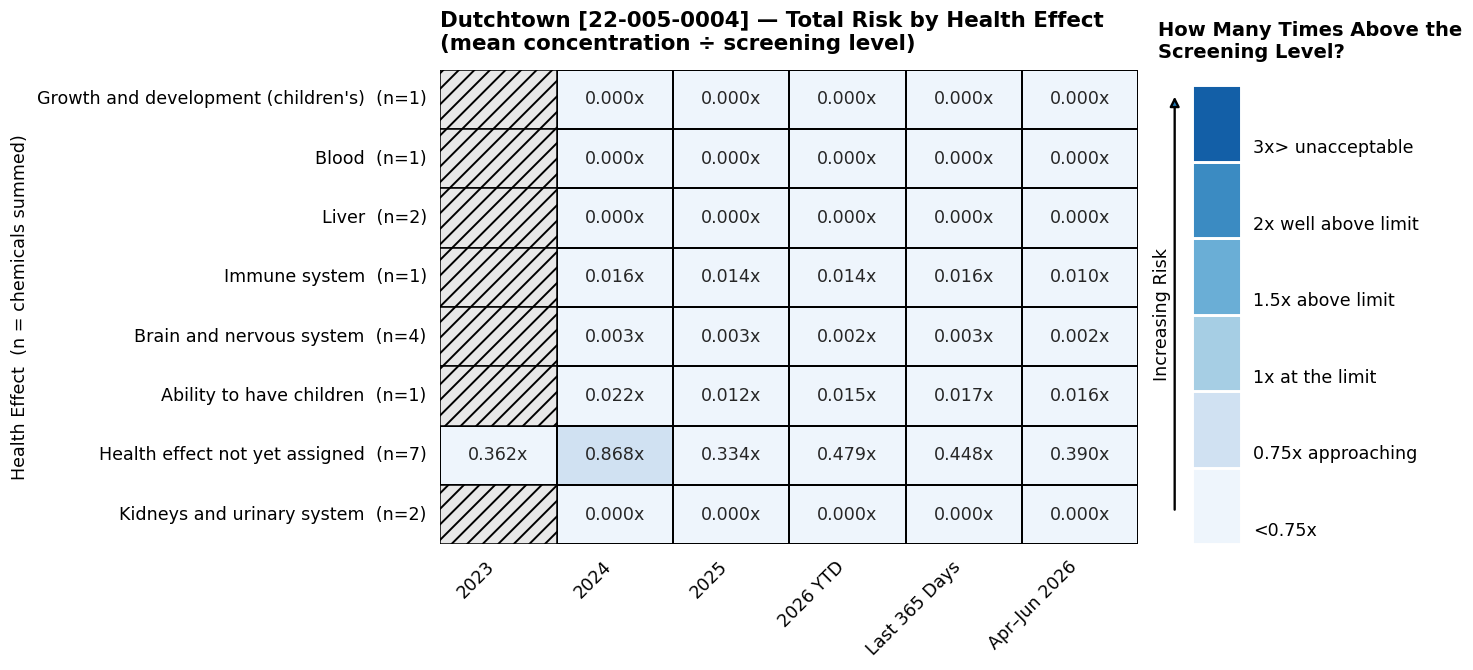
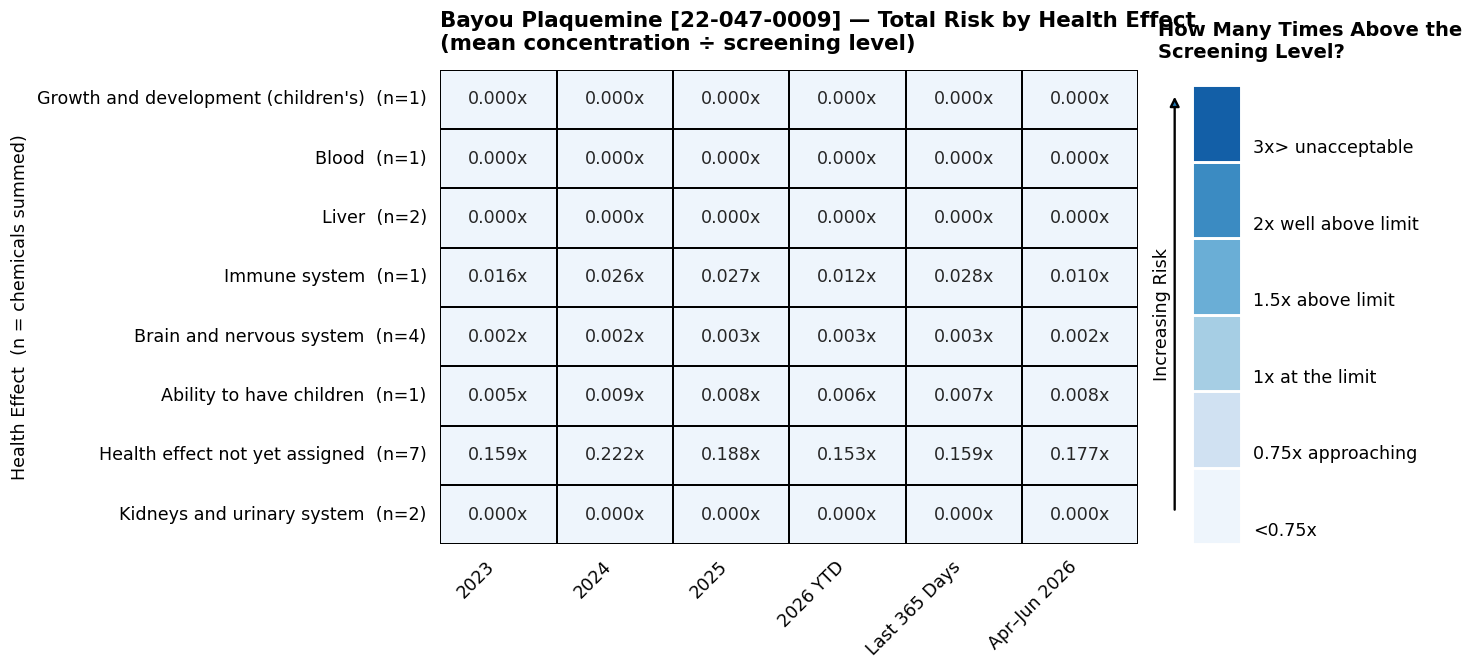
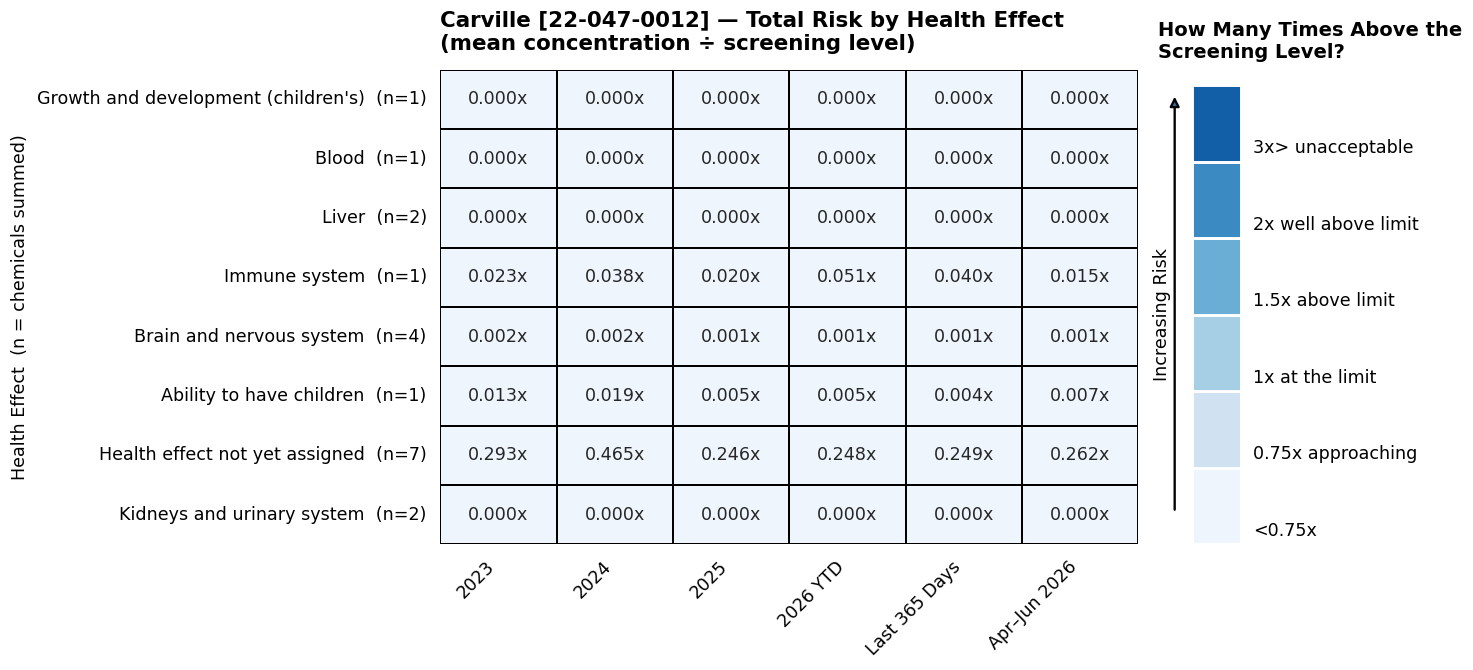
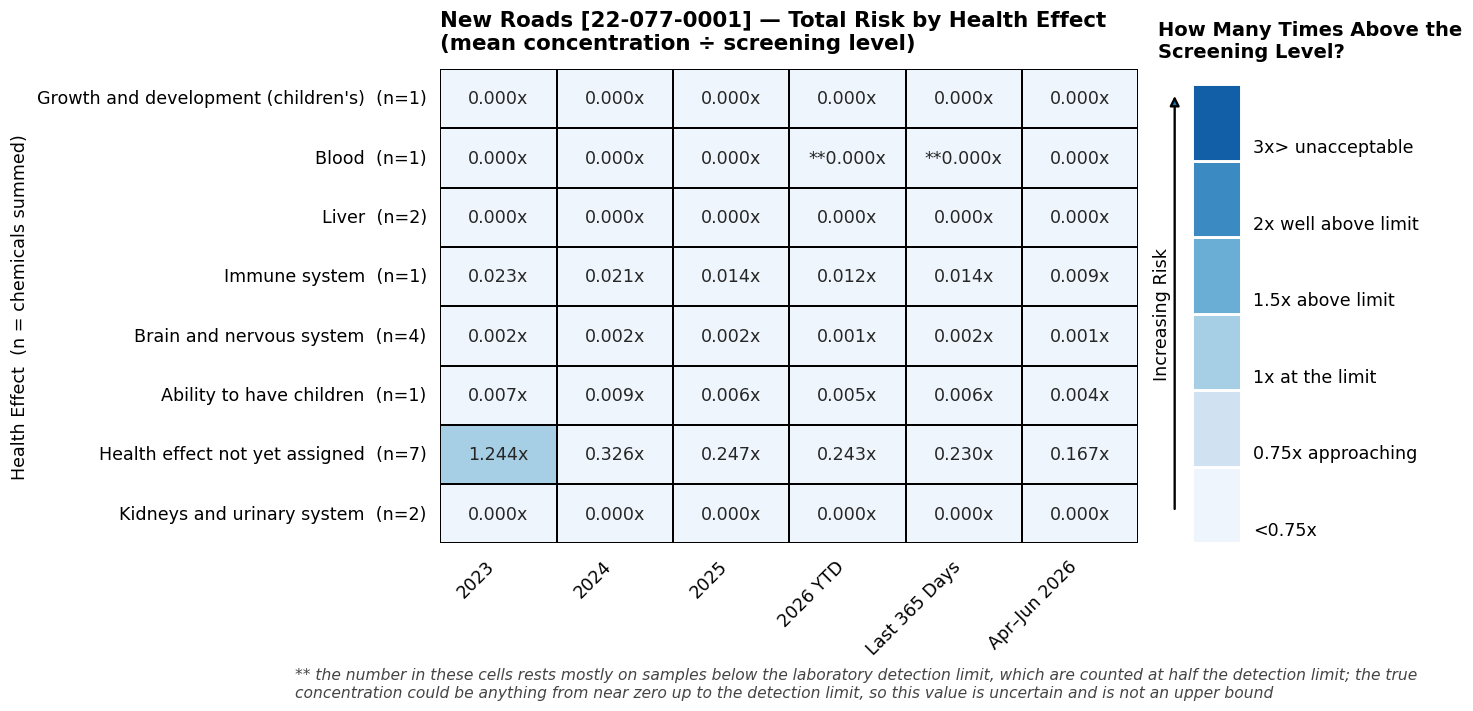
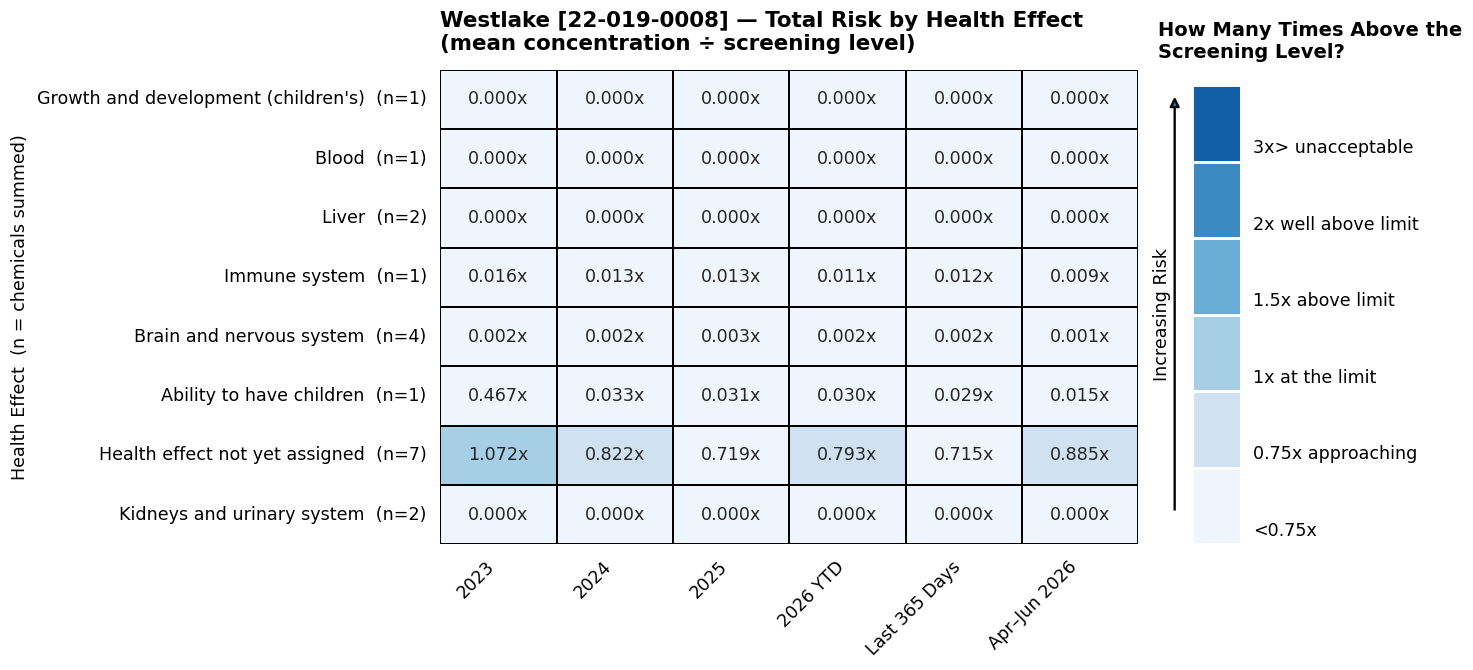
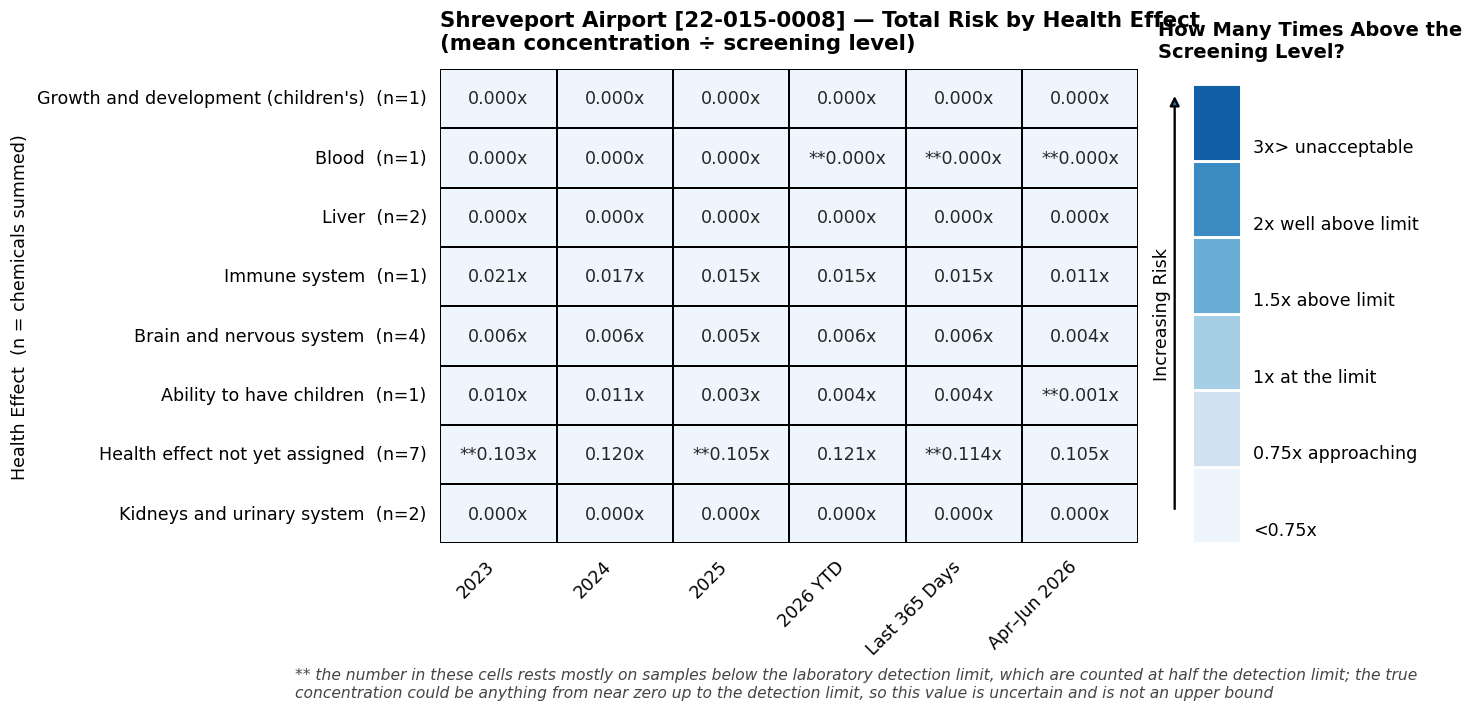
This view reorganizes the other health risk pollutants around geographic location rather than health system affected. Each location card shows one row per health system, and each cell is the combined total — the levels of every chemical that contributes to it, each divided by its screening level and then added together. This is the same “Total” reported for each health effect on the main dashboard, so the two pages agree.
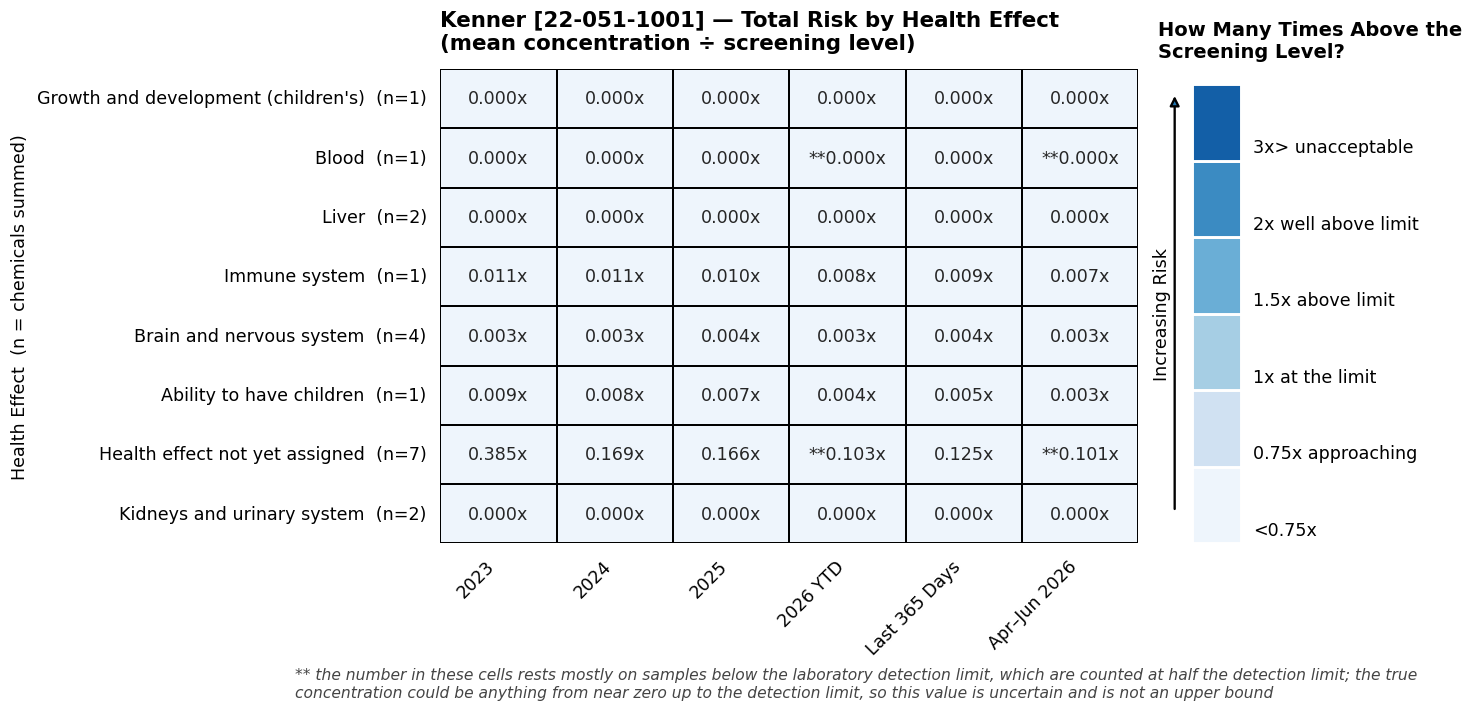
A value below 1.00x means the combined exposure sits below the screening level for that body system; 1.00x is the screening level itself. The (n=) in each row label is the number of chemicals contributing to that total — Brain and Nervous system effects combine 4 chemicals, while Immune system and Reproductive system (or ability to have children) rest on a single chemical each, so totals are not equally well supported. The row Health effect not yet assigned holds the seven pollutants added for Louisiana whose health-effect assignment is still pending.
Across Louisiana, CHATTER follows the sixteen LDEQ monitoring sites that measure hazardous air pollutants with 24-hour canisters — from the New Orleans area through the industrial river corridor to the Baton Rouge area, Lake Charles, Shreveport and Monroe. Each takes a 24-hour canister sample every sixth day.
How to read this plot (click to expand)
Each row is a health effect — a body system that can be harmed, such as the nervous system or the immune system. Each column is a period of time. The number in each square is the total for that health effect: the levels of every pollutant affecting that body system, added together and divided by the screening level, written as a multiple with an “x.”
The (n=) beside each health effect is how many pollutants were added together to make that total. Brain and Nervous system effects combine 4 pollutants, while Immune and Reproductive system (or the ability to have children) each rest on a single one, so the totals are not equally well supported by the data.
A clarifying example.On the Kenner card, find the row for Immune and the column for 2024. The square reads 0.011x. That number means the combined level of the pollutants affecting the immune system was about 1% of the screening level — in other words, well below it.
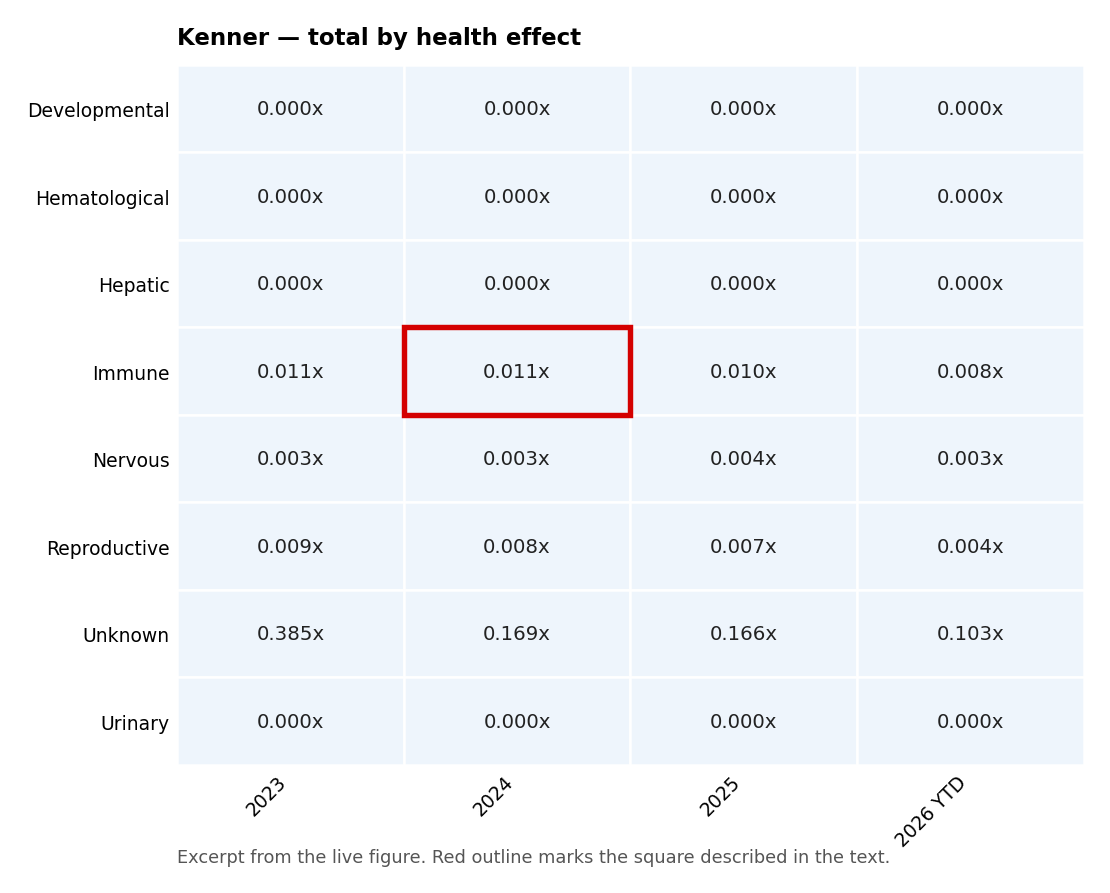
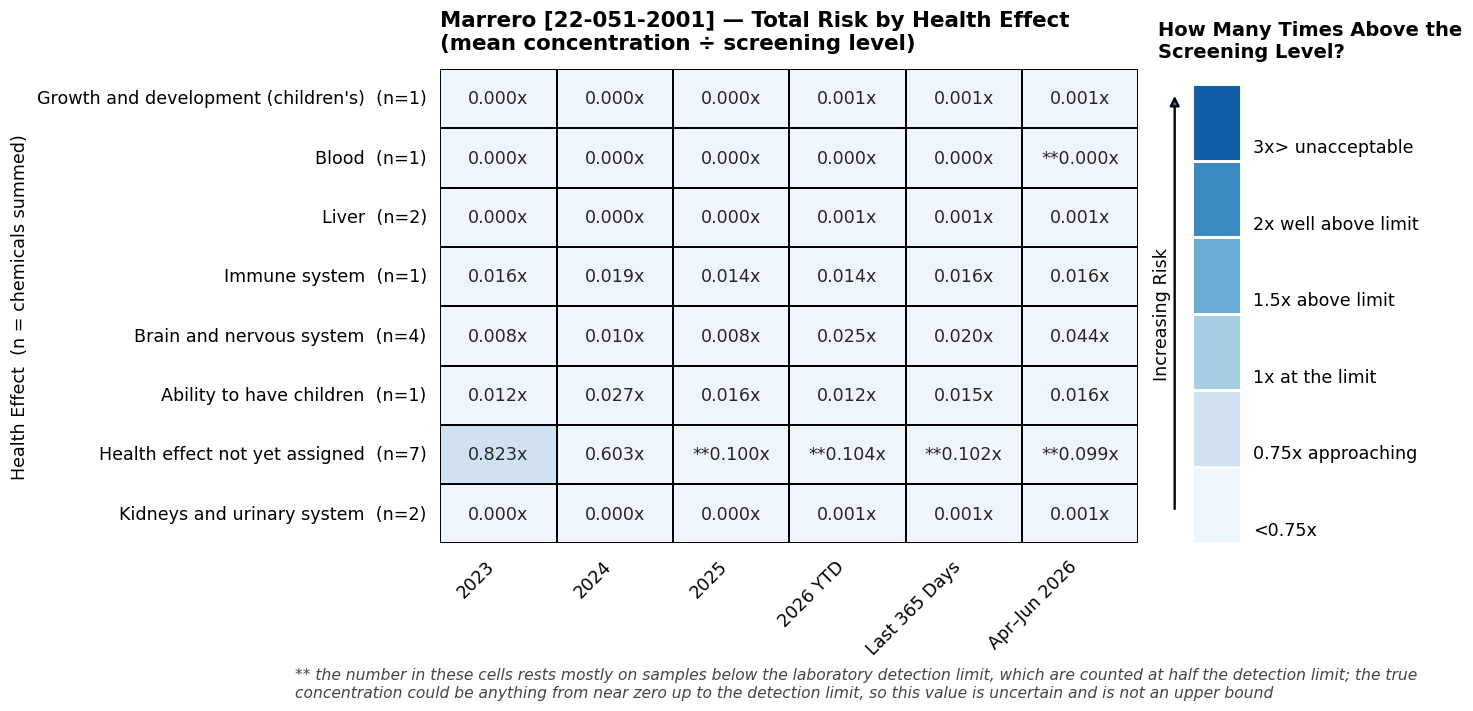
Most of this tab is below the screening level. The color scale does not begin to darken until 0.75x, and nearly every total sits far under that, so most of the grid appears in the palest shade. That is the finding, not a rendering problem. The row to watch is Health effect not yet assigned, which carries acrylonitrile: at industrial-corridor sites such as Marrero and Chalmette Vista it approaches or reaches the screening level in the earlier years shown. Read the numbers to compare health effects and years to see changes over time.
For the general explanation of heat maps, see the Frequently Asked Questions.
Jefferson Parish — 2 monitors: Kenner, Marrero
St. Bernard Parish — 1 monitor: Chalmette Vista
St. Tammany Parish — 1 monitor: Madisonville
East Baton Rouge Parish — 4 monitors: LSU, Capitol, Pride, East Baton Rouge 2002
West Baton Rouge Parish — 1 monitor: Port Allen
Ascension Parish — 1 monitor: Dutchtown
Iberville Parish — 2 monitors: Bayou Plaquemine, Carville
Pointe Coupee Parish — 1 monitor: New Roads
Calcasieu Parish — 1 monitor: Westlake
Bossier Parish — 1 monitor: Shreveport Airport
Ouachita Parish — 1 monitor: Monroe Airport