The Clean Air Act identifies 6 air pollutants that pose the greatest health risks. They are known as criteria pollutants. This section tracks four EPA criteria pollutants — sulfur dioxide (SO₂), nitrogen dioxide (NO₂), ozone (O₃), and fine particle pollution (PM₂.₅) — measured at the state-run (LDEQ) regulatory monitors across Louisiana that report to EPA’s Air Quality System. Design values are specific to a monitoring location, so there is one card per monitor, and the cards are grouped under parish headers. Every card shows all four criteria pollutants, with the ones a monitor does not measure marked as such, so a location can be read as a complete picture of its criteria-pollutant concerns. Parishes are arranged by region — the New Orleans area first, then the Capital/Baton Rouge area, Acadiana, the southwest, central and north Louisiana — so neighbouring locations sit together.
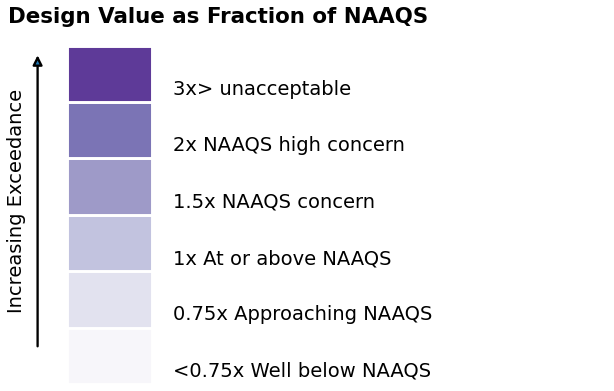
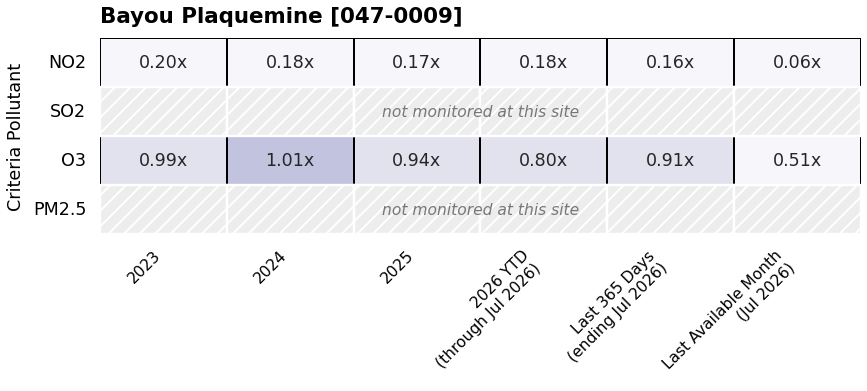
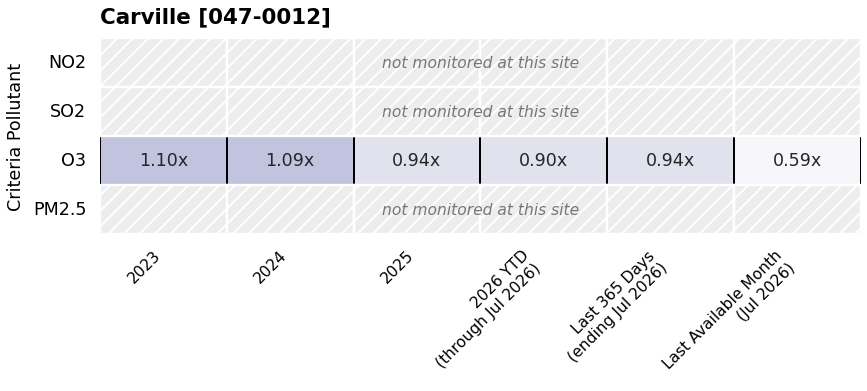
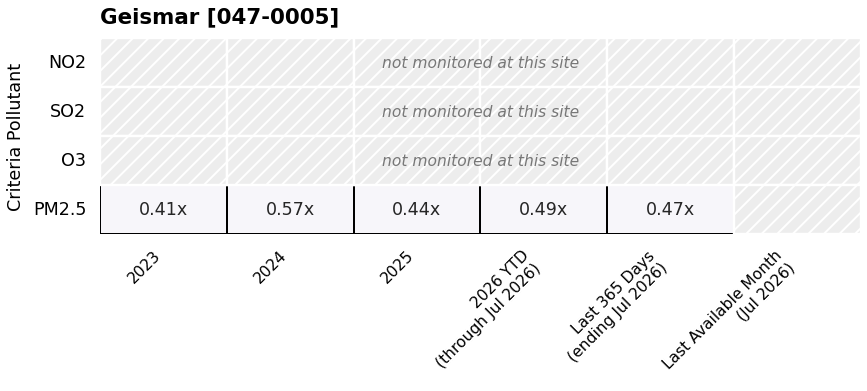
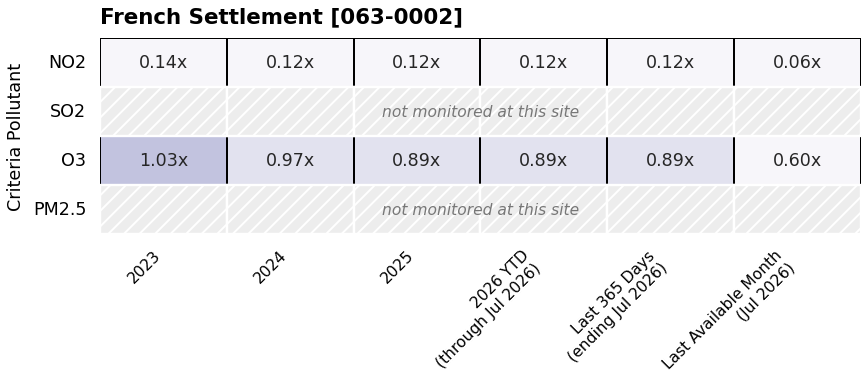
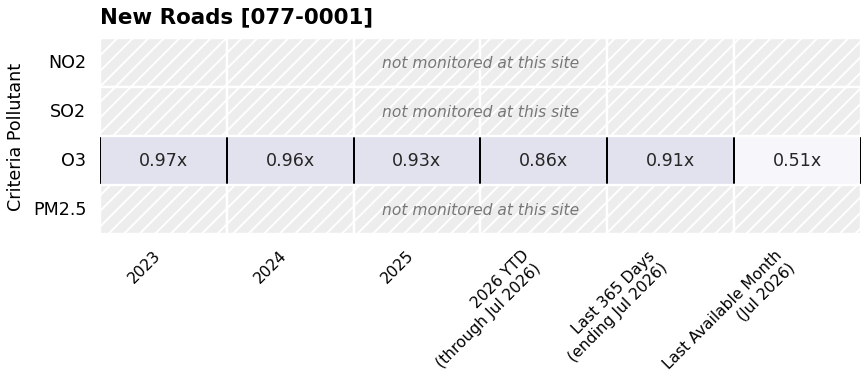
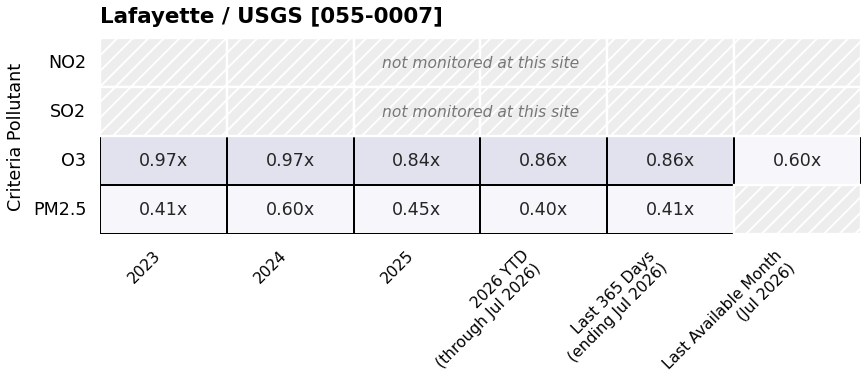
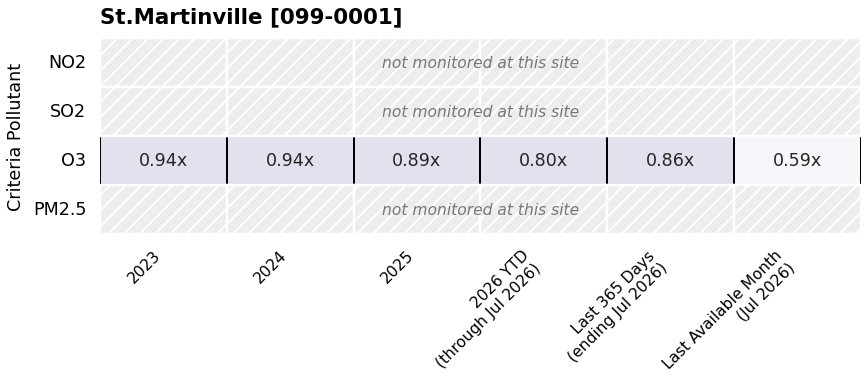
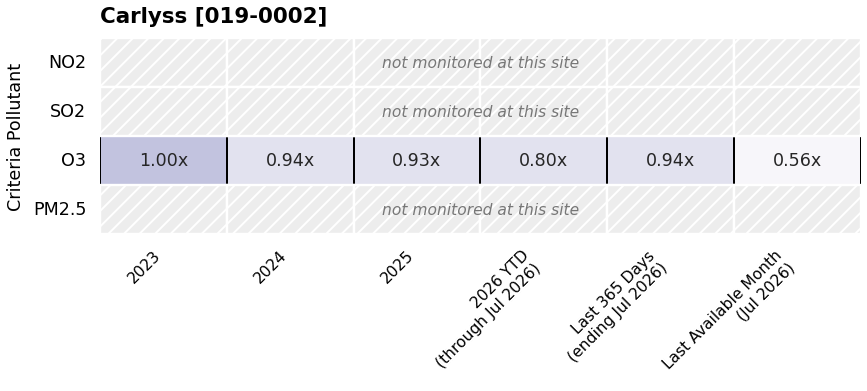
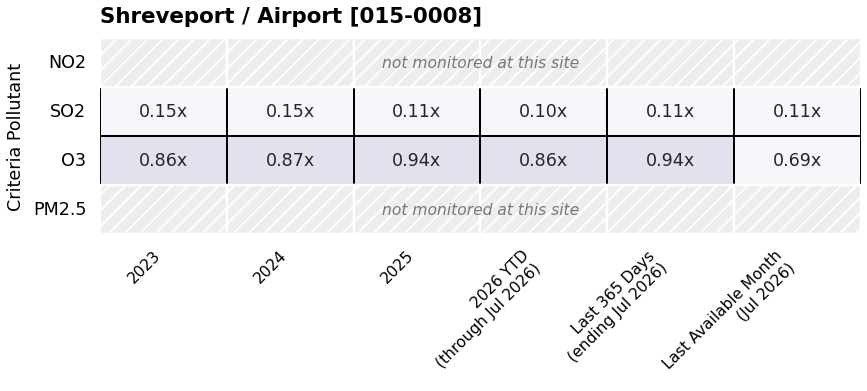
The EPA uses air monitoring data to determine if pollution levels meet the Clean Air Act requirements. They make these decisions based on a number representing all the measurements over a year taken at an air monitor. It is called a Design Value. It represents the highest pollution levels in that area. In the figure, each cell shows the EPA Design Value for that pollutant divided by the corresponding National Ambient Air Quality Standard (NAAQS). A value below 1.00 means the design value is within the standard; values above 1.00 indicate the yearly average is greater than the Clean Air Act (NAAQS) standard and poses an increased health risk. Design values are computed using the same statistics EPA uses to determine if air pollution levels in the region are meeting the criteria set by the Clean Air Act. Columns cover single-year design values plus a year-to-date column, a rolling Last 365 Days window and the Last Available Month. EPA AQS releases data on a delay of weeks to months, so each of those three headings names, on its second line, the month the criteria data actually ends in. The color scale is shared across all locations, so cards can be compared directly.
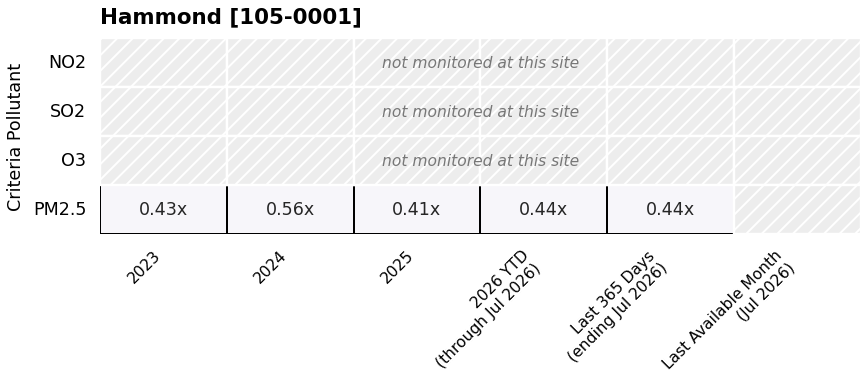
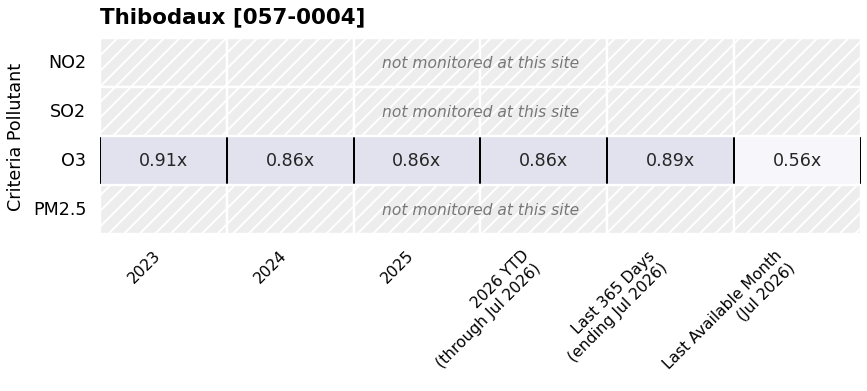
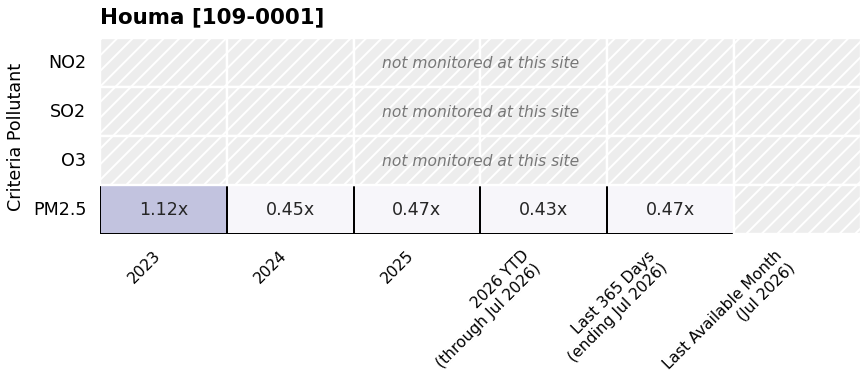
Not every monitor measures every pollutant. Hatched gray cells mean no measurement exists — a pollutant that is not monitored at this site is shown as an empty hatched row rather than being hidden, so a gap in coverage is never mistaken for a clean reading.
How to read this plot (click to expand)
Each row is one of the six EPA criteria pollutants. Only four EPA criteria pollutants are measured. Each column is a period of time. Unlike the other tabs, the number here is not compared to a screening level — it is the EPA design value divided by the National Ambient Air Quality Standard (NAAQS), written as a multiple with an “x.”
A design value is the particular statistic EPA uses for each pollutant when comparing a monitor against its standard, rather than a simple average. (The FAQ explains which statistic is used for each pollutant.) Below 1.00x means the pollutant is within the standard; above 1.00x means it is above the standard.
Design values are specific to a monitoring location, so there is one card per monitor. The cards are grouped under parish headers — each header names the parish and lists its monitors — and the parishes are arranged by region (the New Orleans area first, then the Capital/Baton Rouge area, Acadiana, the southwest, central and north Louisiana), so neighbouring locations sit together. Where a parish has several monitors, compare their cards directly: they often measure different pollutants.
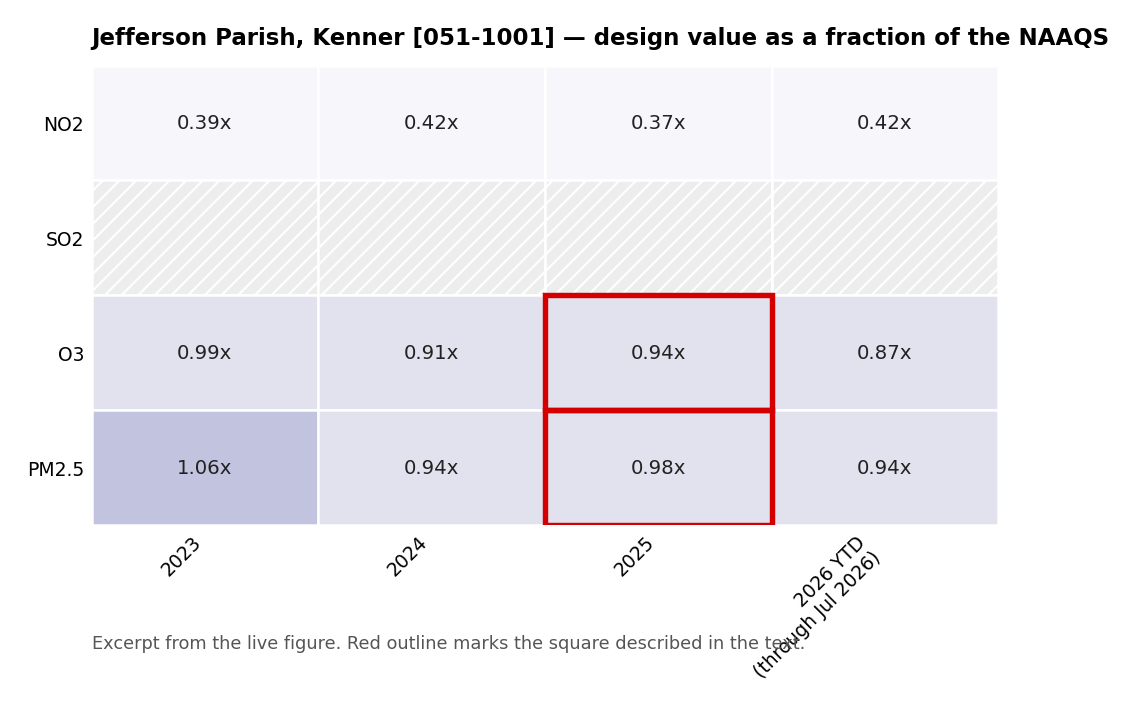
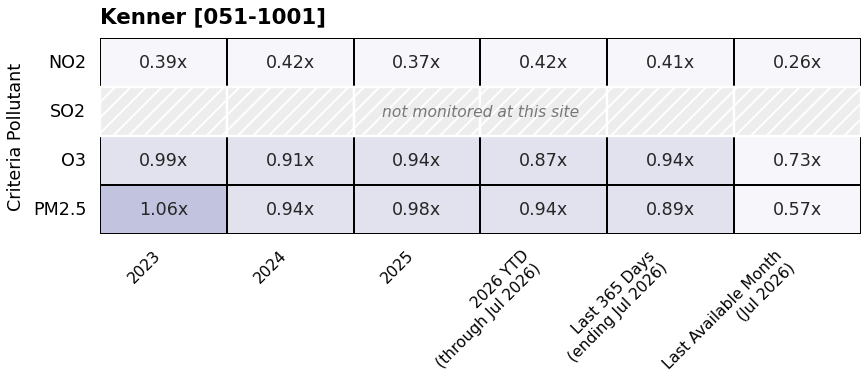
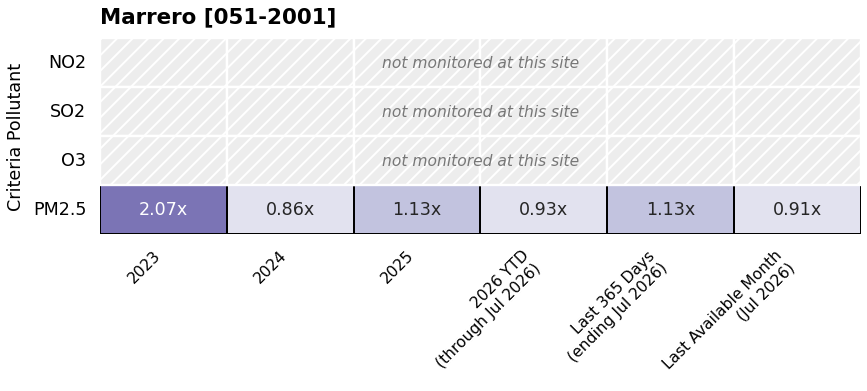
A clarifying example.Under the Jefferson Parish header, on the Kenner card, find the row for O3 (ozone) and the column for 2025. The square reads 0.94x — Kenner’s ozone design value for 2025 was 6% below the national standard. In the same column, NO2 reads 0.37x, comfortably under, and PM₂.₅ reads 0.98x — just under the 24-hour fine-particle standard. The neighbouring Marrero card measures only PM₂.₅, and its 2023 value of 2.07x is the highest on the tab.
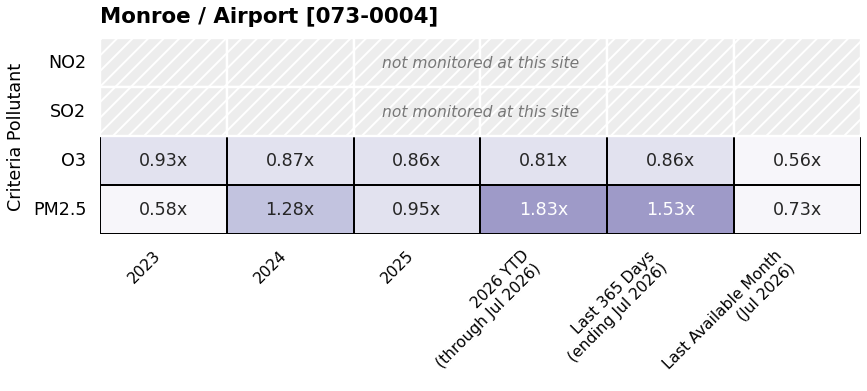
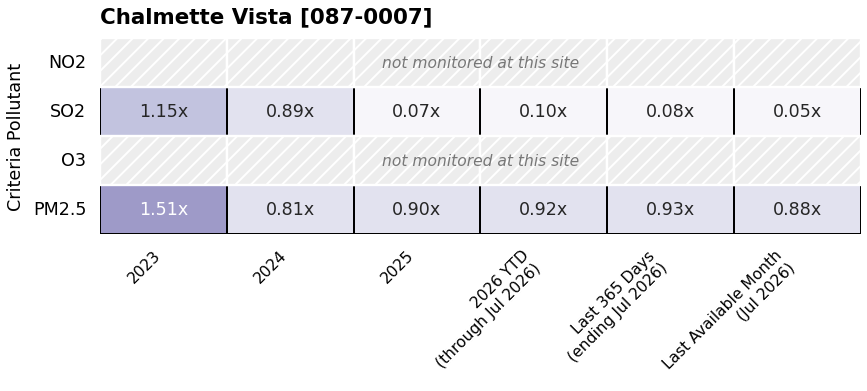
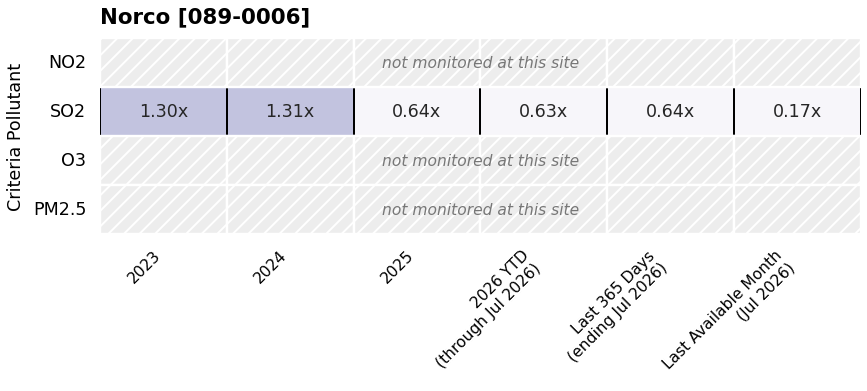
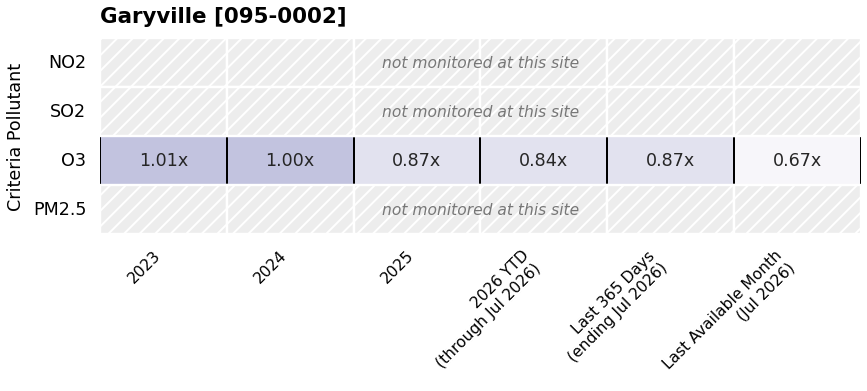
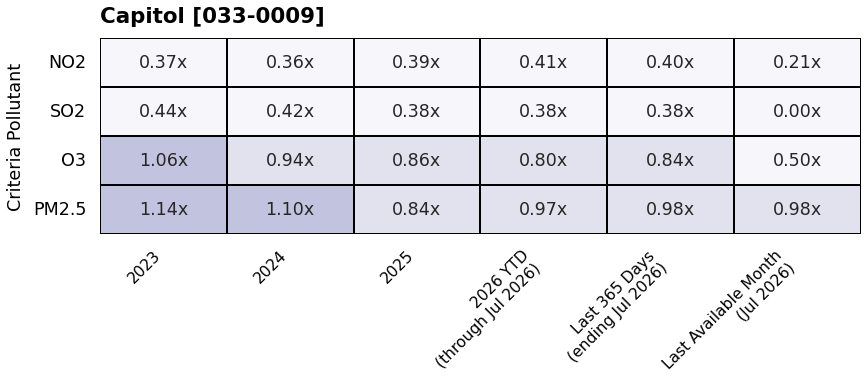
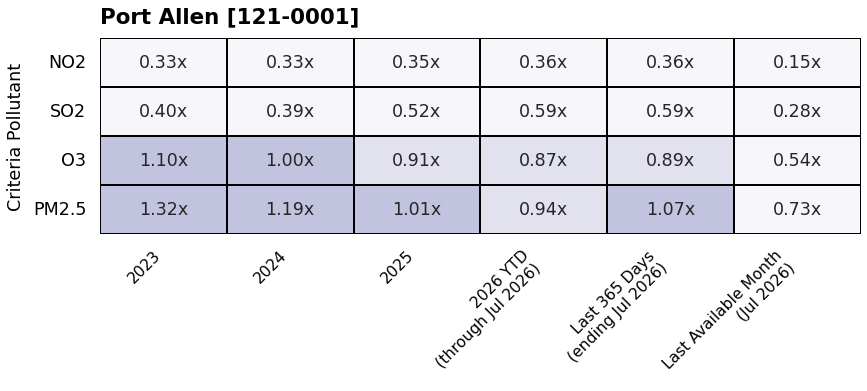
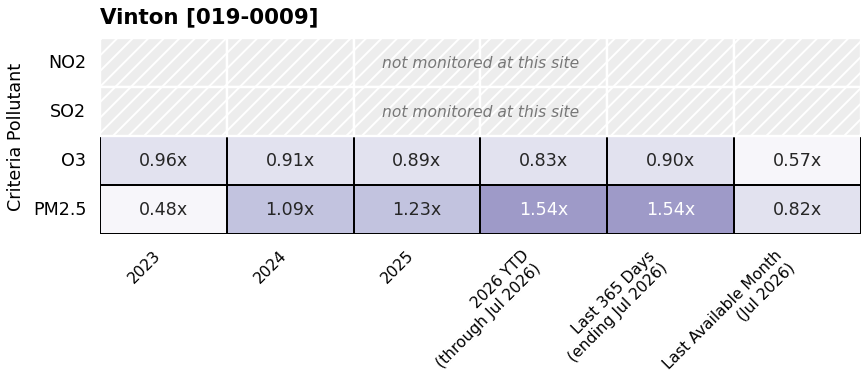
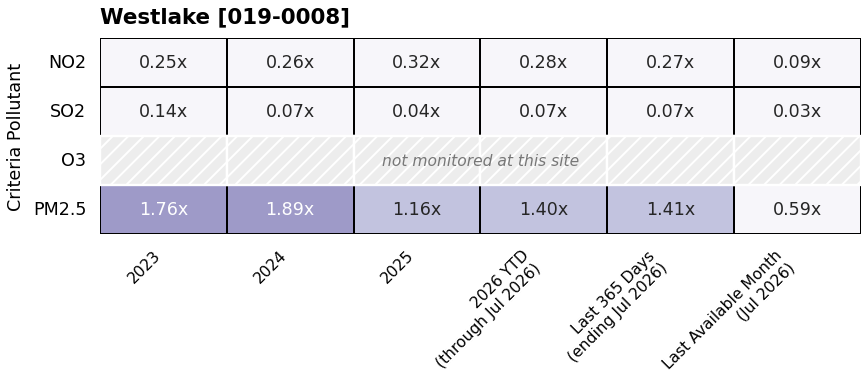
Fine particles are where the exceedances show up. Single-year PM₂.₅ design values reached above the 24-hour standard at several monitors: Marrero (Jefferson) at 2.07x in 2023, Westlake (Calcasieu) at 1.89x in 2024, Monroe Airport (Ouachita) at 1.83x in the 2026 year-to-date column, and Vinton (Calcasieu) and Chalmette Vista (St. Bernard) each above 1.5x in at least one recent period. Sulfur dioxide crossed the standard at Norco (St. Charles; 1.31x in 2024) and Chalmette Vista (1.15x in 2023). Ozone sat just above the standard in 2023 and 2024 at several Baton Rouge-area monitors — Port Allen, Carville, LSU and Capitol, each between 1.01x and 1.10x — and has been below it since. Nitrogen dioxide stayed within the standard at every monitor that measures it. (The PM₂.₅ comparison here is against the 24-hour standard.)
This tab runs later than the other two. The criteria monitors report continuously and reach EPA’s database within weeks, while the canister results behind the cancer-risk and other-health-risk tabs arrive months later, so the criteria tab shows more recent years and its year-to-date, Last 365 Days and monthly columns end at a later date. The last three columns name their ending month. EPA AQS, the source for this tab, releases data weeks to months after the fact, so the year-to-date, Last 365 Days and monthly columns here each carry, on a second line, the month the criteria data actually ends in — for example “Last 365 Days (ending Jul 2026)” is the 365 days up to the end of July. A site whose own data ends earlier than that month shows a blank cell rather than older data.
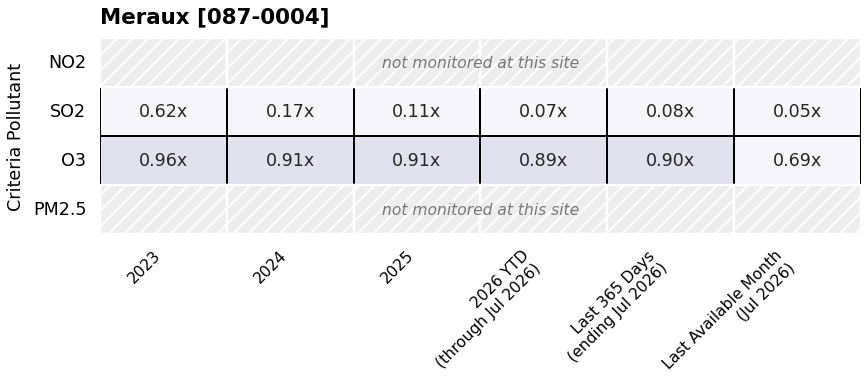
Hatched gray rows labeled “not monitored at this site” mean that monitor does not measure that pollutant at all. Coverage is uneven across the state: most monitors measure only ozone or only fine particles; nitrogen dioxide is measured at just a handful of sites, and sulfur dioxide mainly in the industrial river parishes.
One caution. These are single-year values. EPA’s official design values, the ones used to decide whether an area meets the Clean Air Act standard, average three consecutive years to make a decision, ensuring that a single stand-out year does not unduly influence compliance determinations. So a value above 1.00x here is a signal worth a closer look, not an official finding that the area violated the standard.
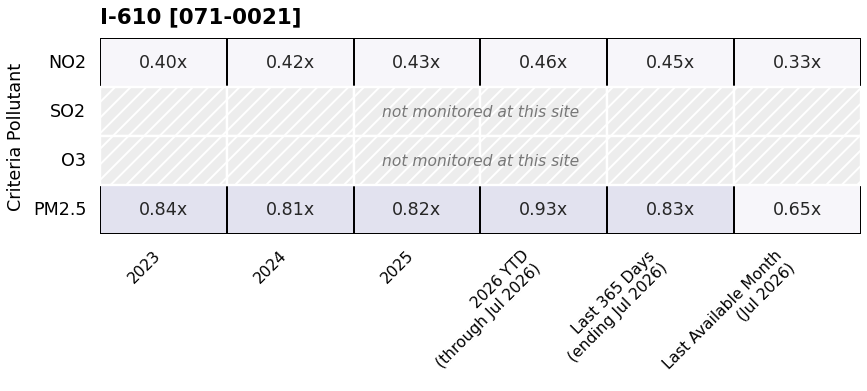
Orleans Parish — 1 monitor: I-610
Jefferson Parish — 2 monitors: Kenner, Marrero
St. Bernard Parish — 2 monitors: Chalmette Vista, Meraux
St. Charles Parish — 1 monitor: Norco
St. John the Baptist Parish — 1 monitor: Garyville
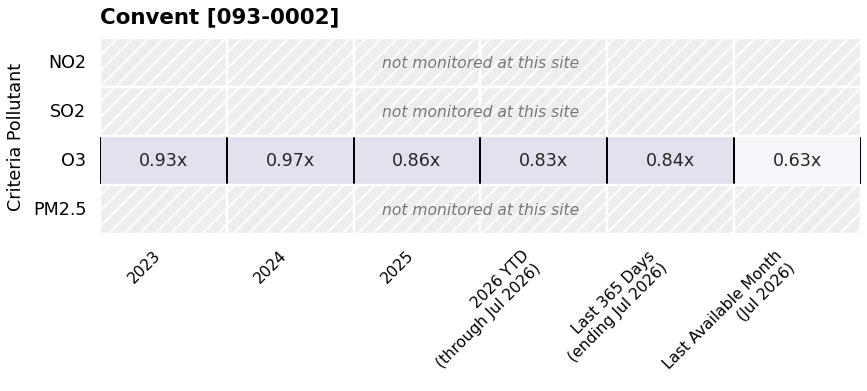
St. James Parish — 1 monitor: Convent
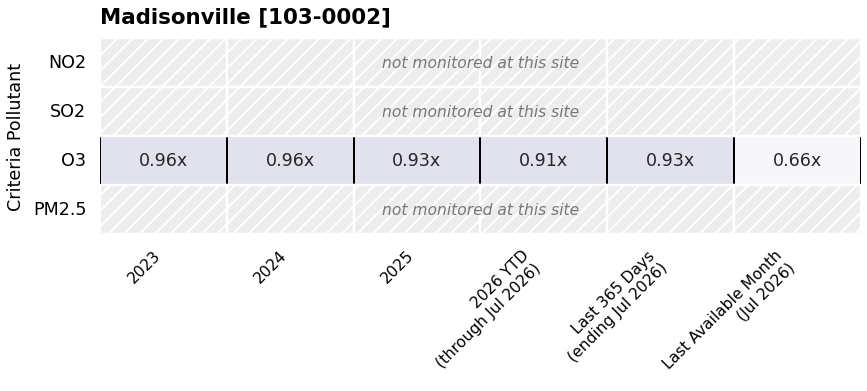
St. Tammany Parish — 1 monitor: Madisonville
Tangipahoa Parish — 1 monitor: Hammond
Lafourche Parish — 1 monitor: Thibodaux
Terrebonne Parish — 1 monitor: Houma
East Baton Rouge Parish — 3 monitors: Capitol, LSU, Pride
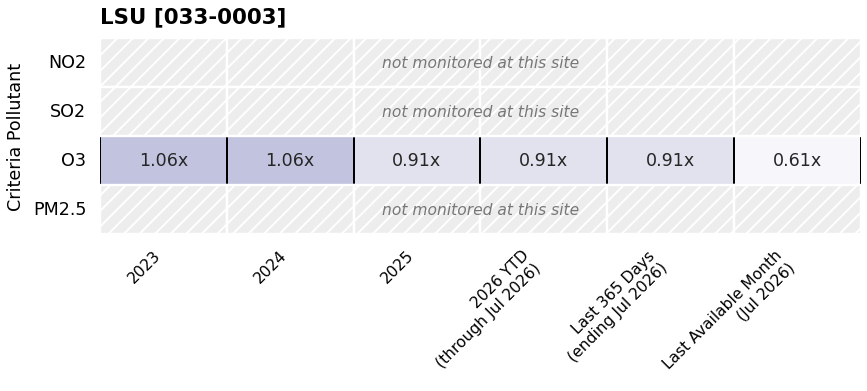
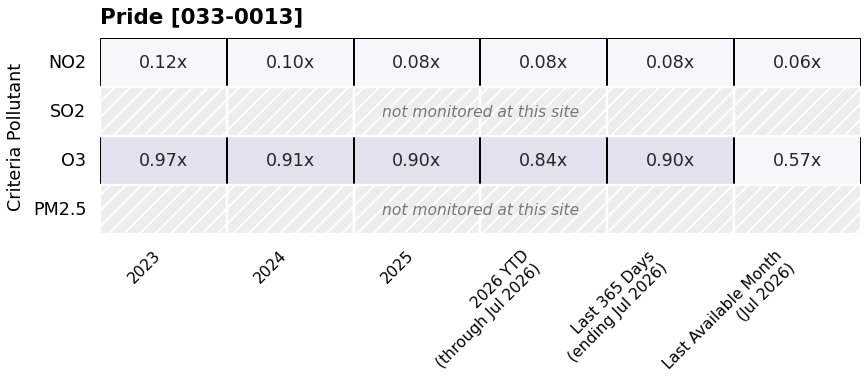
West Baton Rouge Parish — 1 monitor: Port Allen
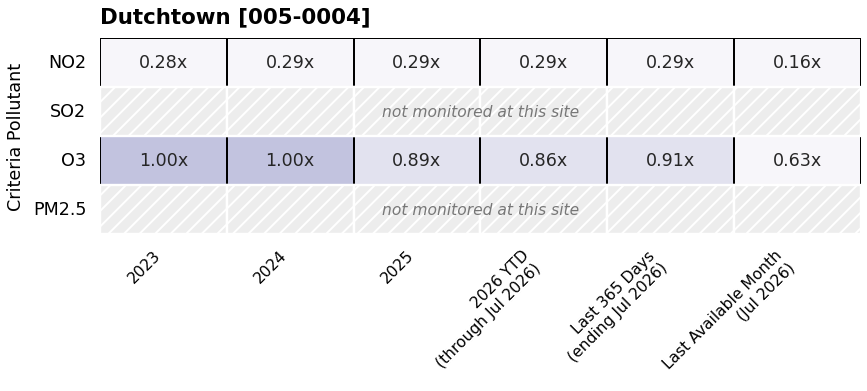
Ascension Parish — 1 monitor: Dutchtown
Iberville Parish — 3 monitors: Bayou Plaquemine, Carville, Geismar
Livingston Parish — 1 monitor: French Settlement
Pointe Coupee Parish — 1 monitor: New Roads
Lafayette Parish — 1 monitor: Lafayette / USGS
St. Martin Parish — 1 monitor: St.Martinville
Calcasieu Parish — 3 monitors: Carlyss, Vinton, Westlake
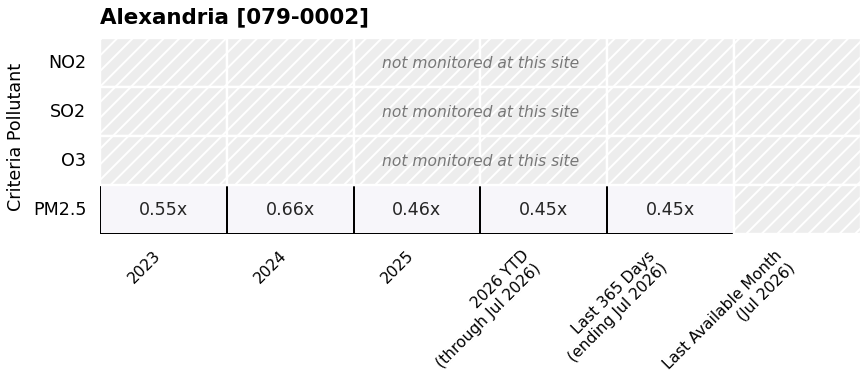
Rapides Parish — 1 monitor: Alexandria
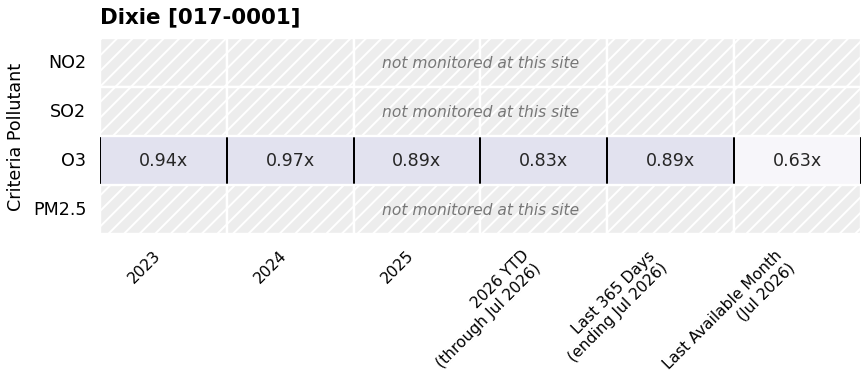
Caddo Parish — 3 monitors: Dixie, Shreveport / Calumet, Shreveport Calumet
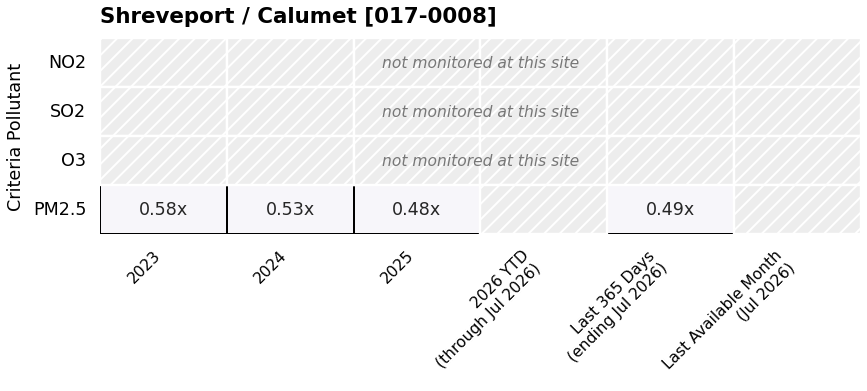
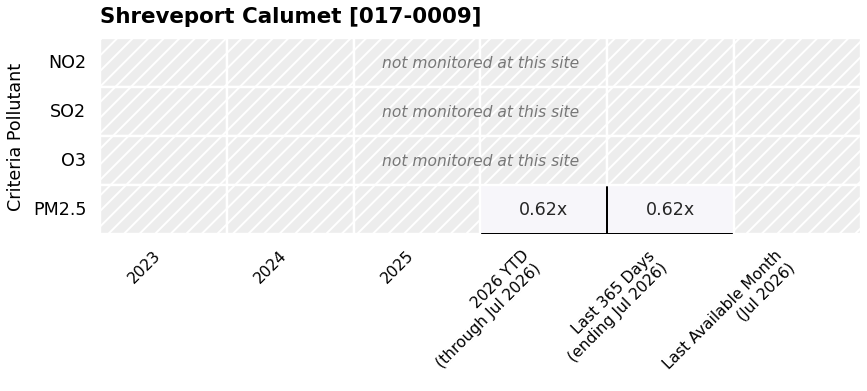
Bossier Parish — 1 monitor: Shreveport / Airport
Ouachita Parish — 1 monitor: Monroe / Airport