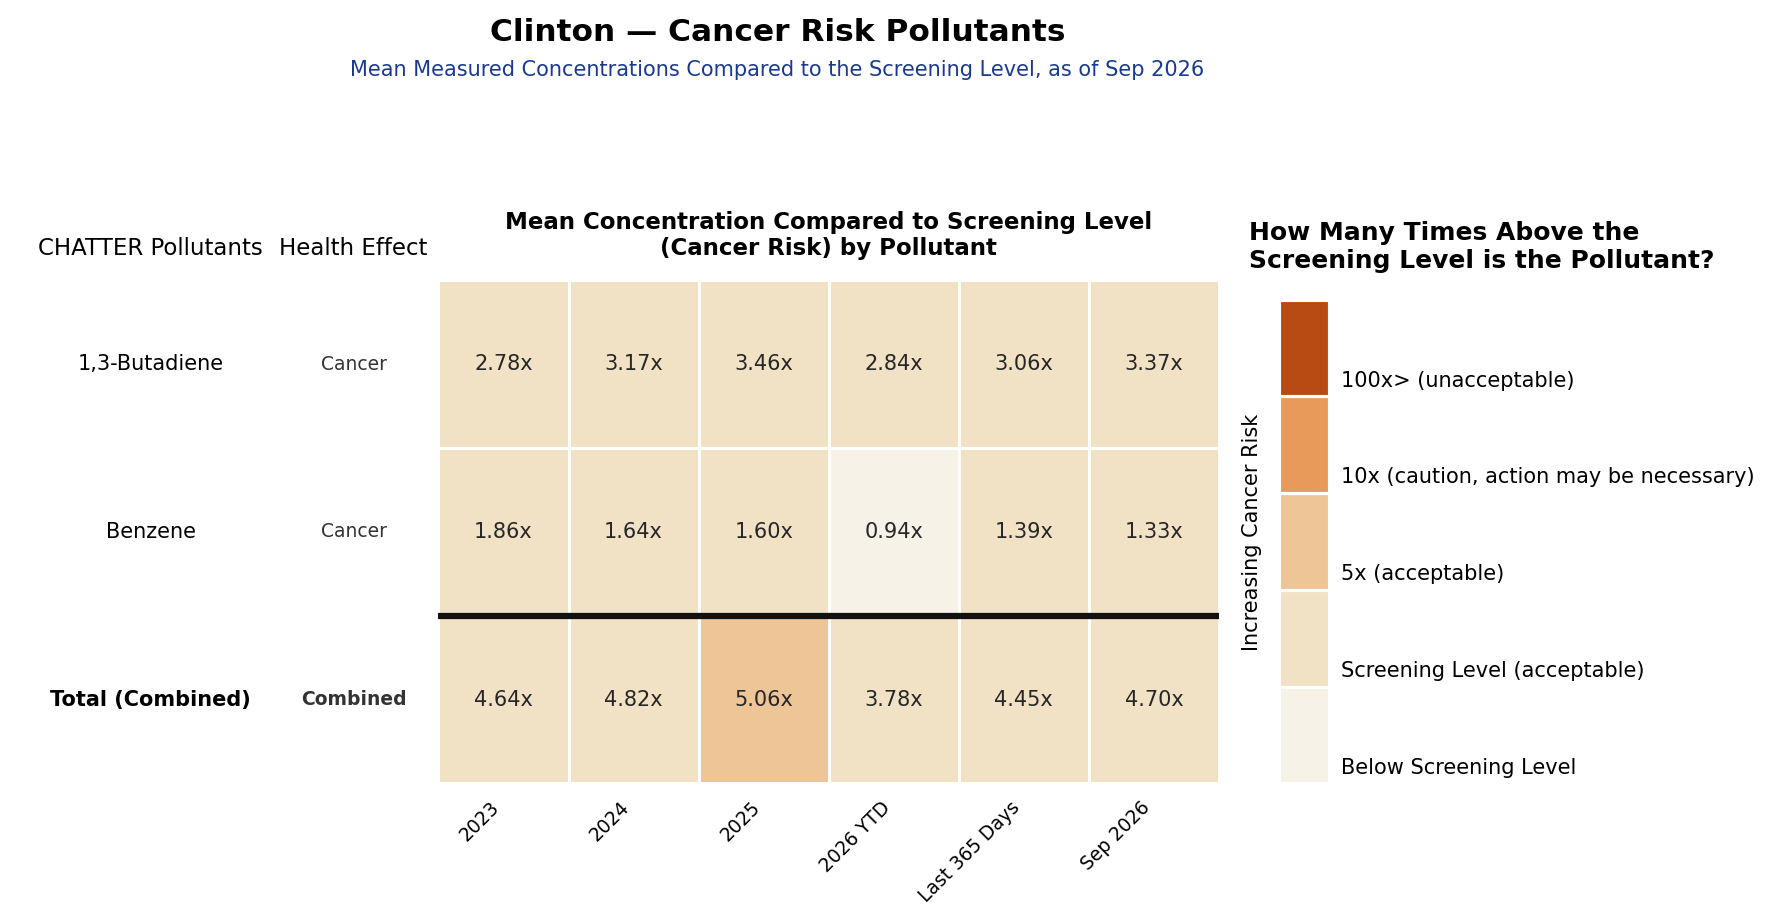
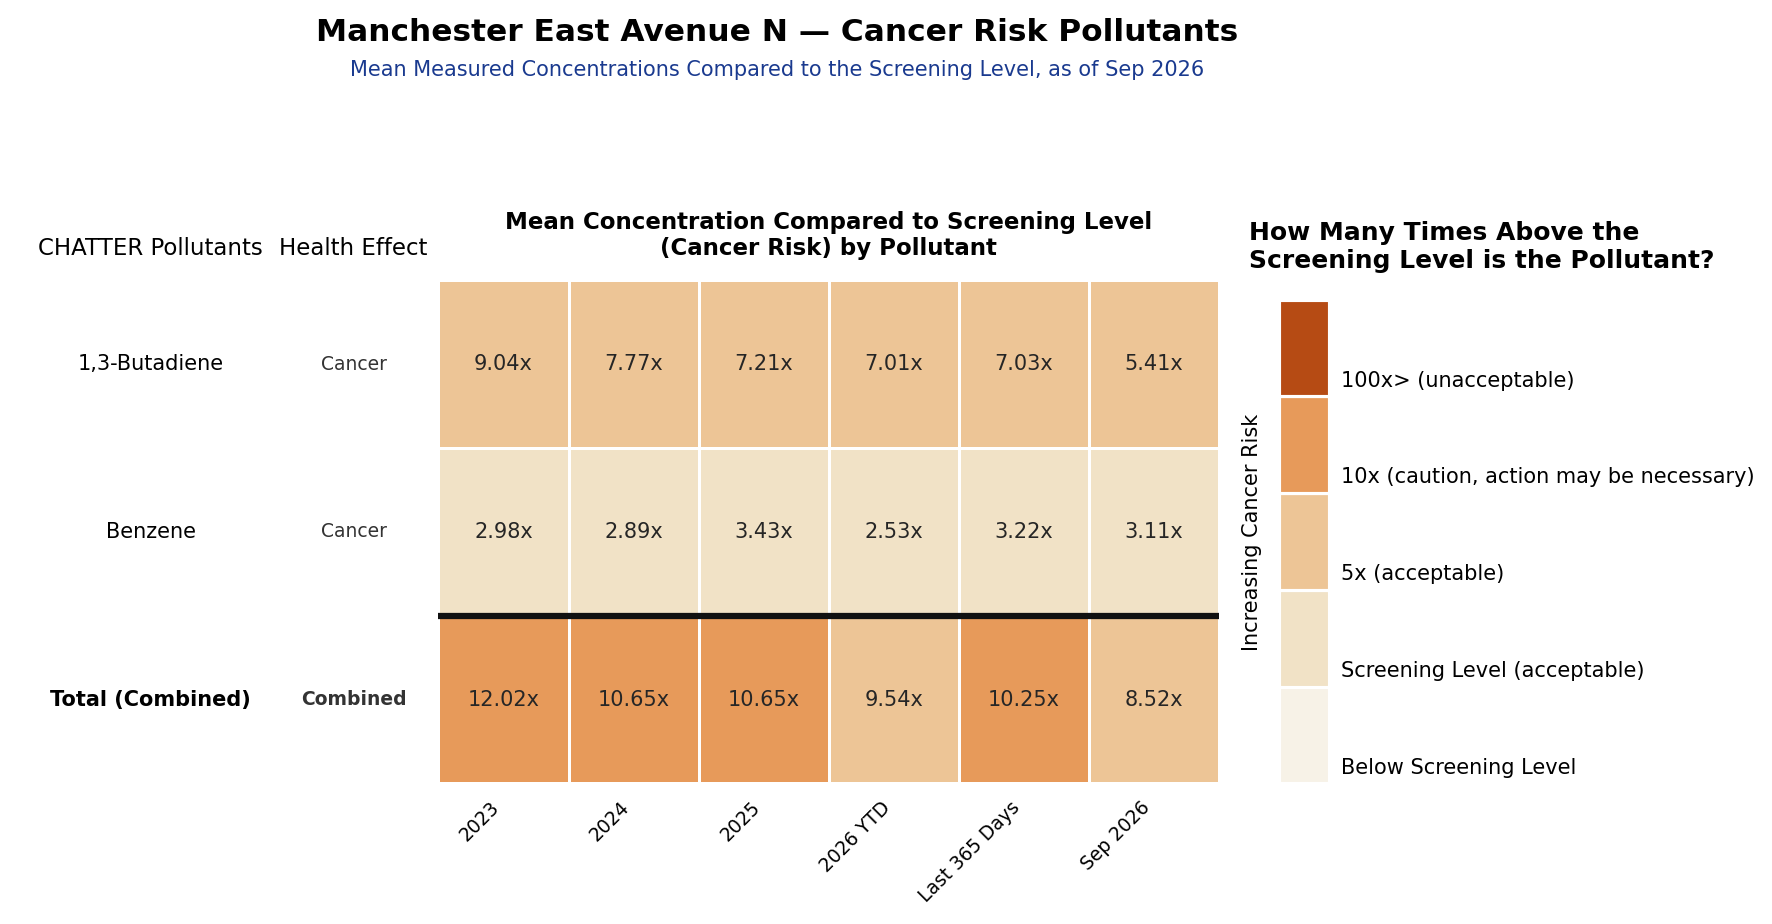
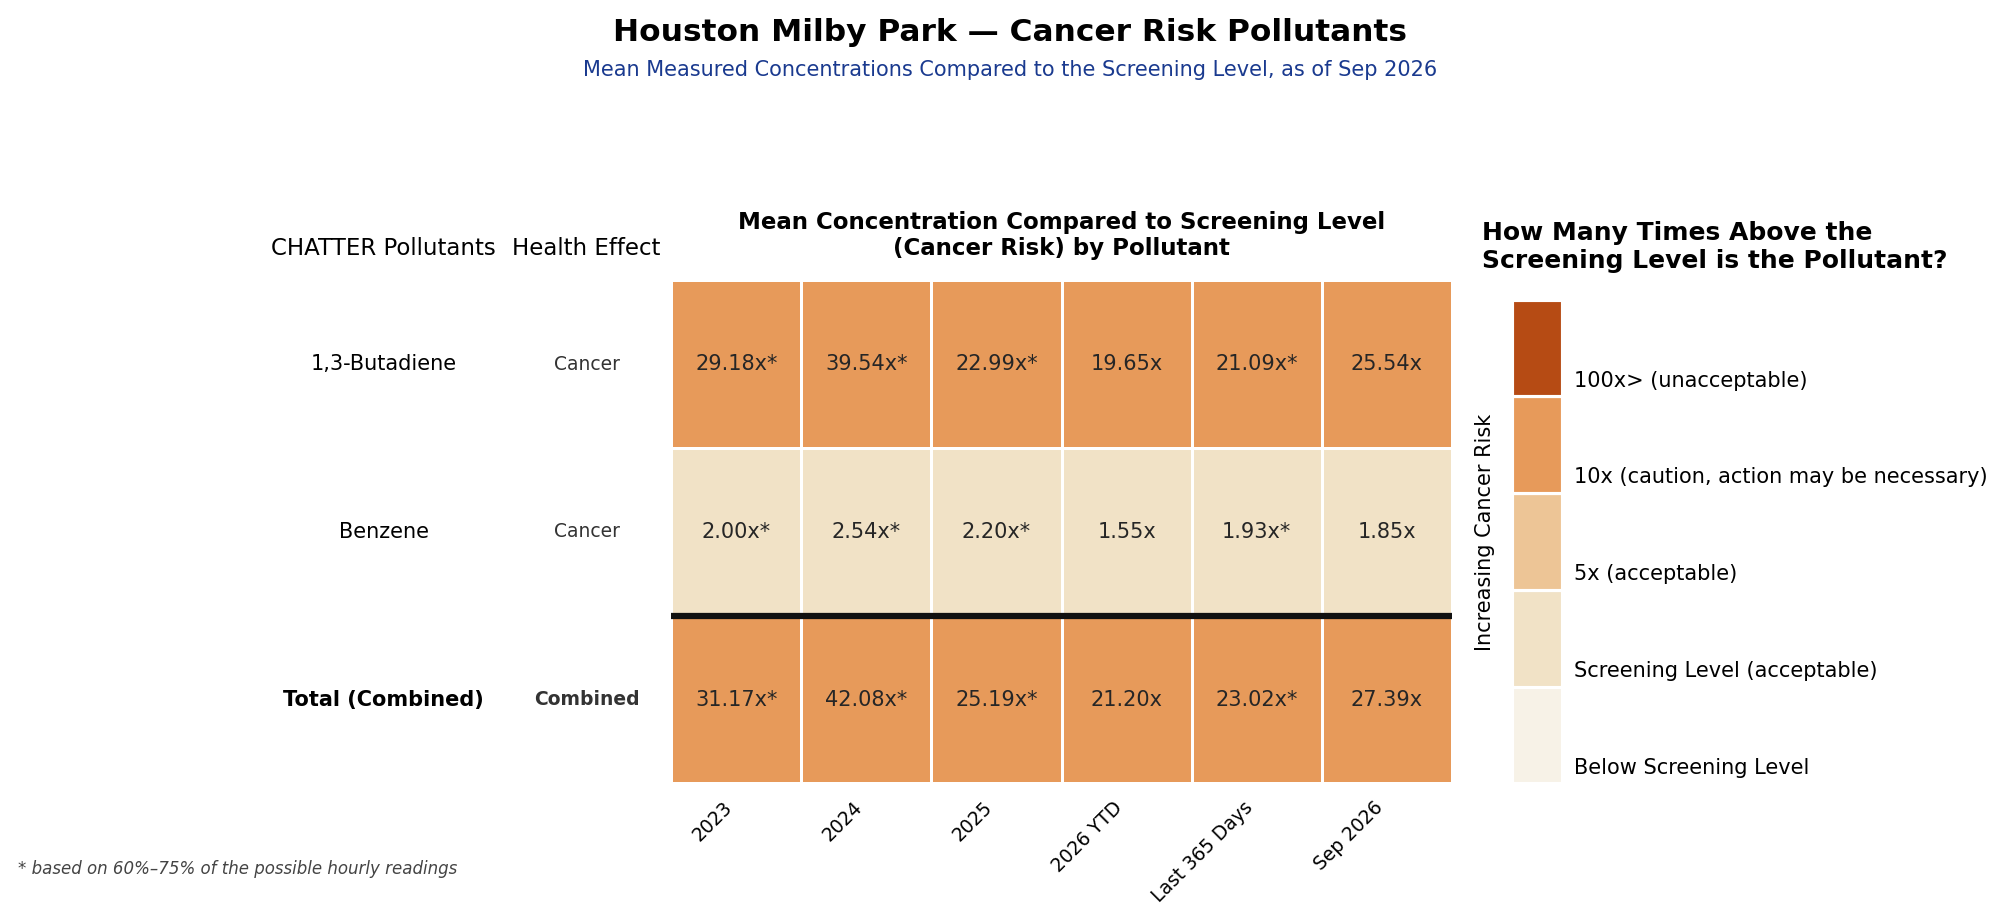
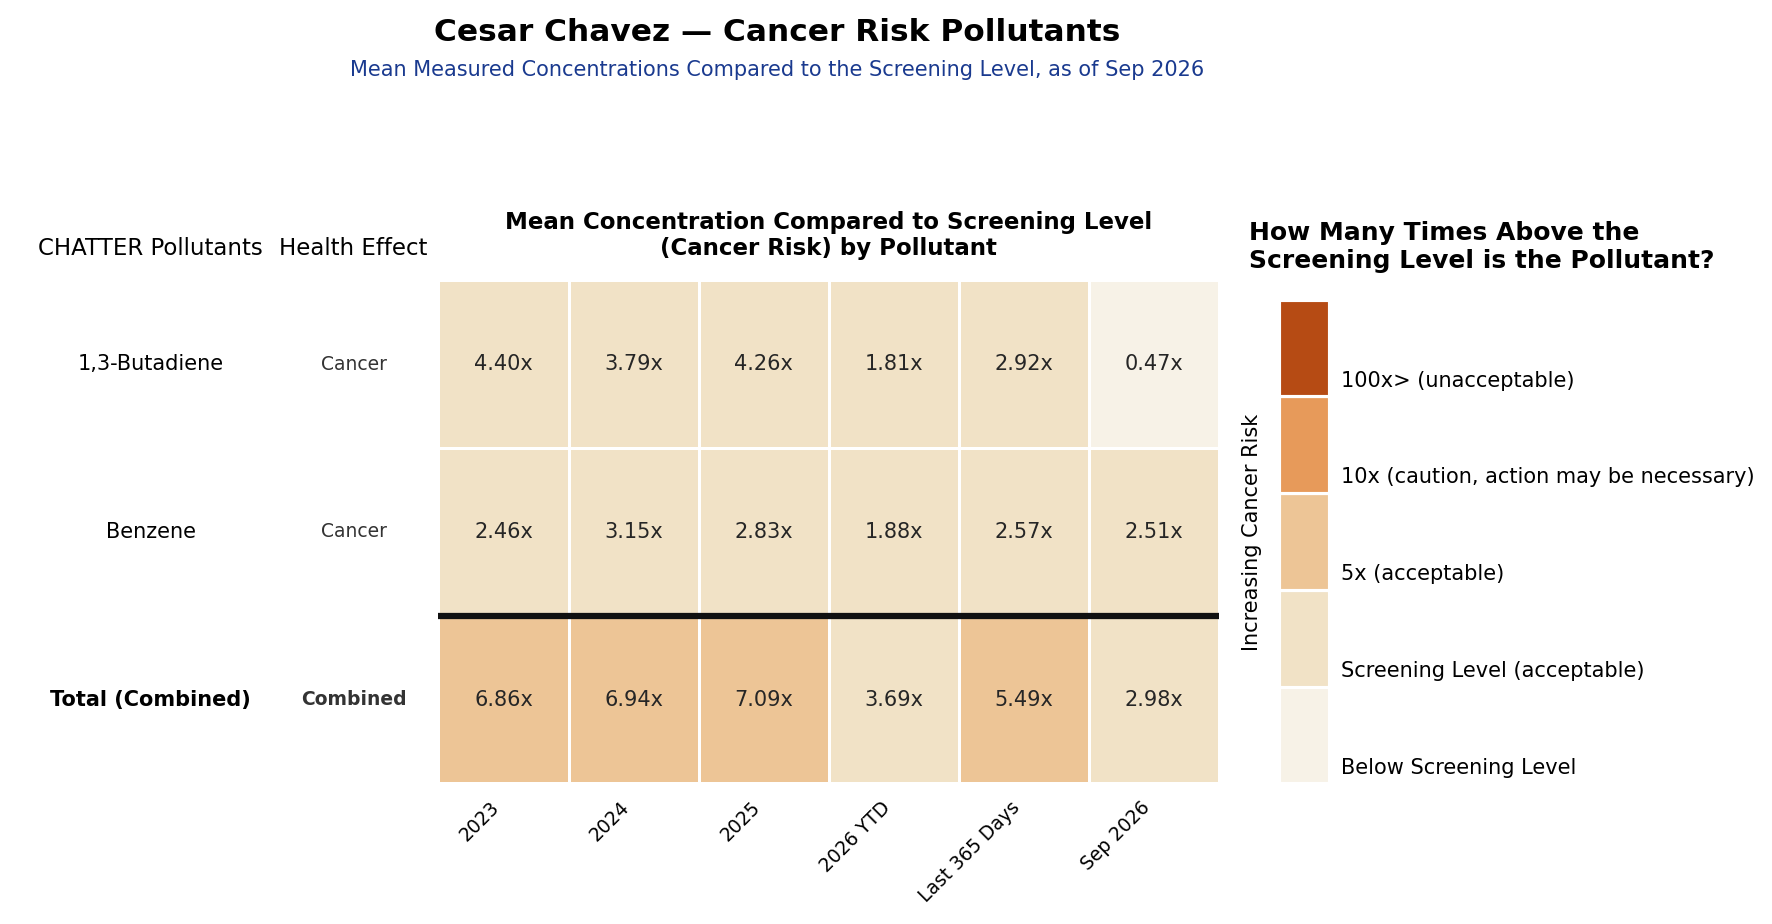
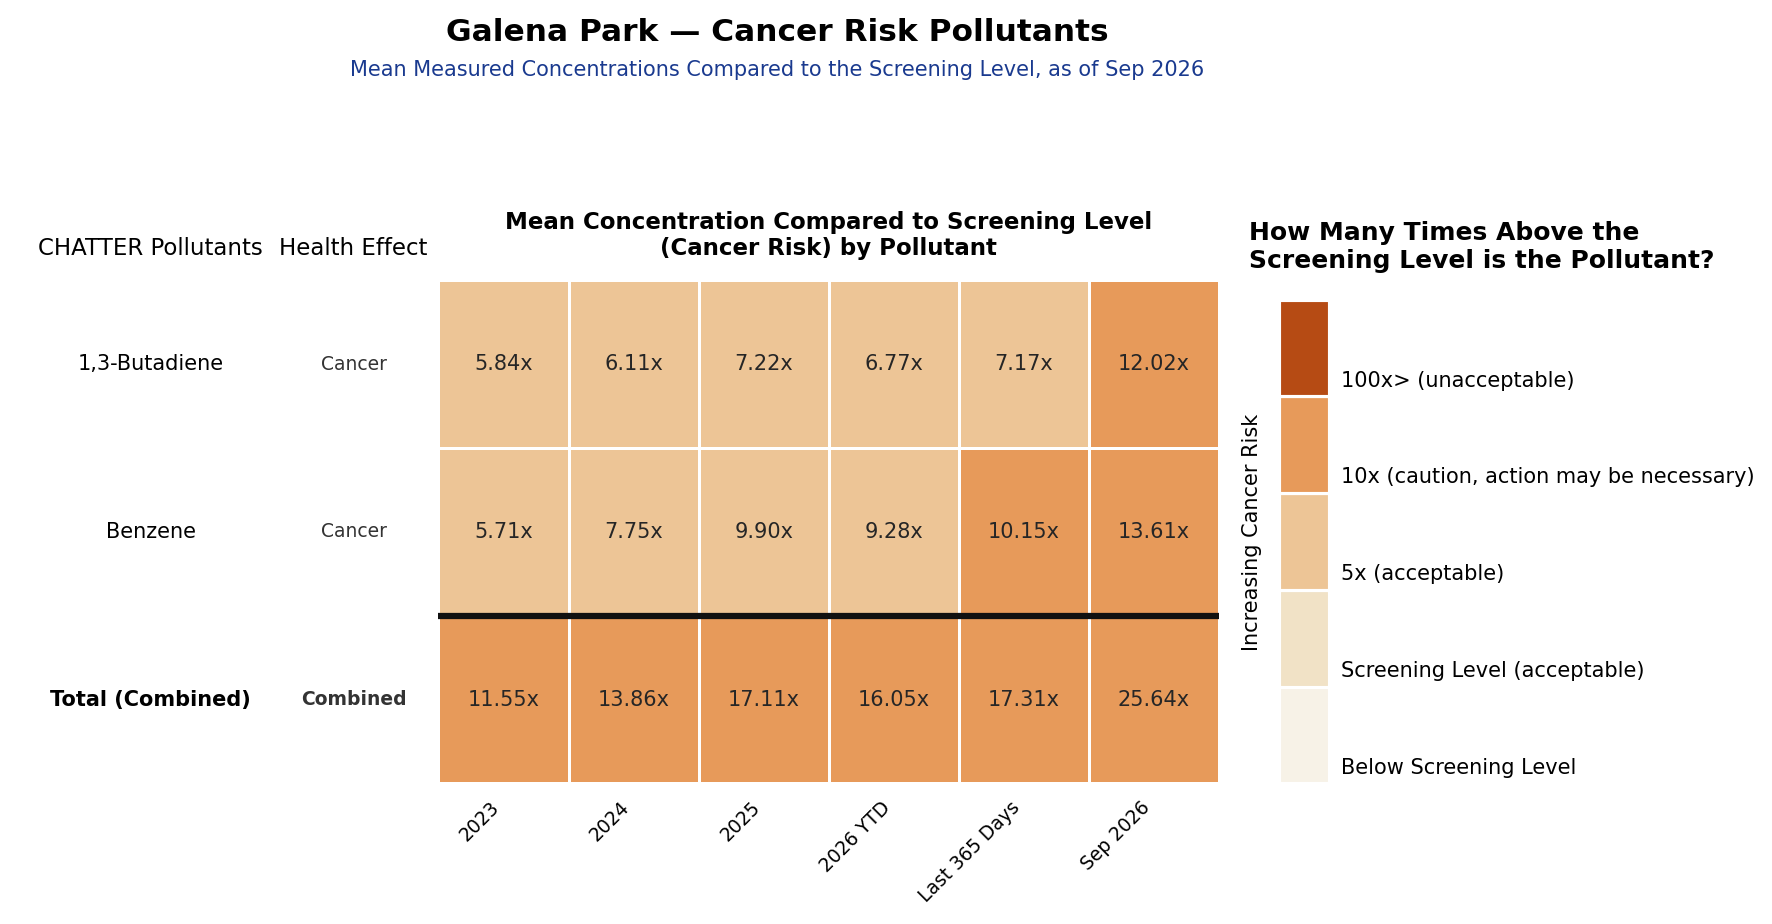
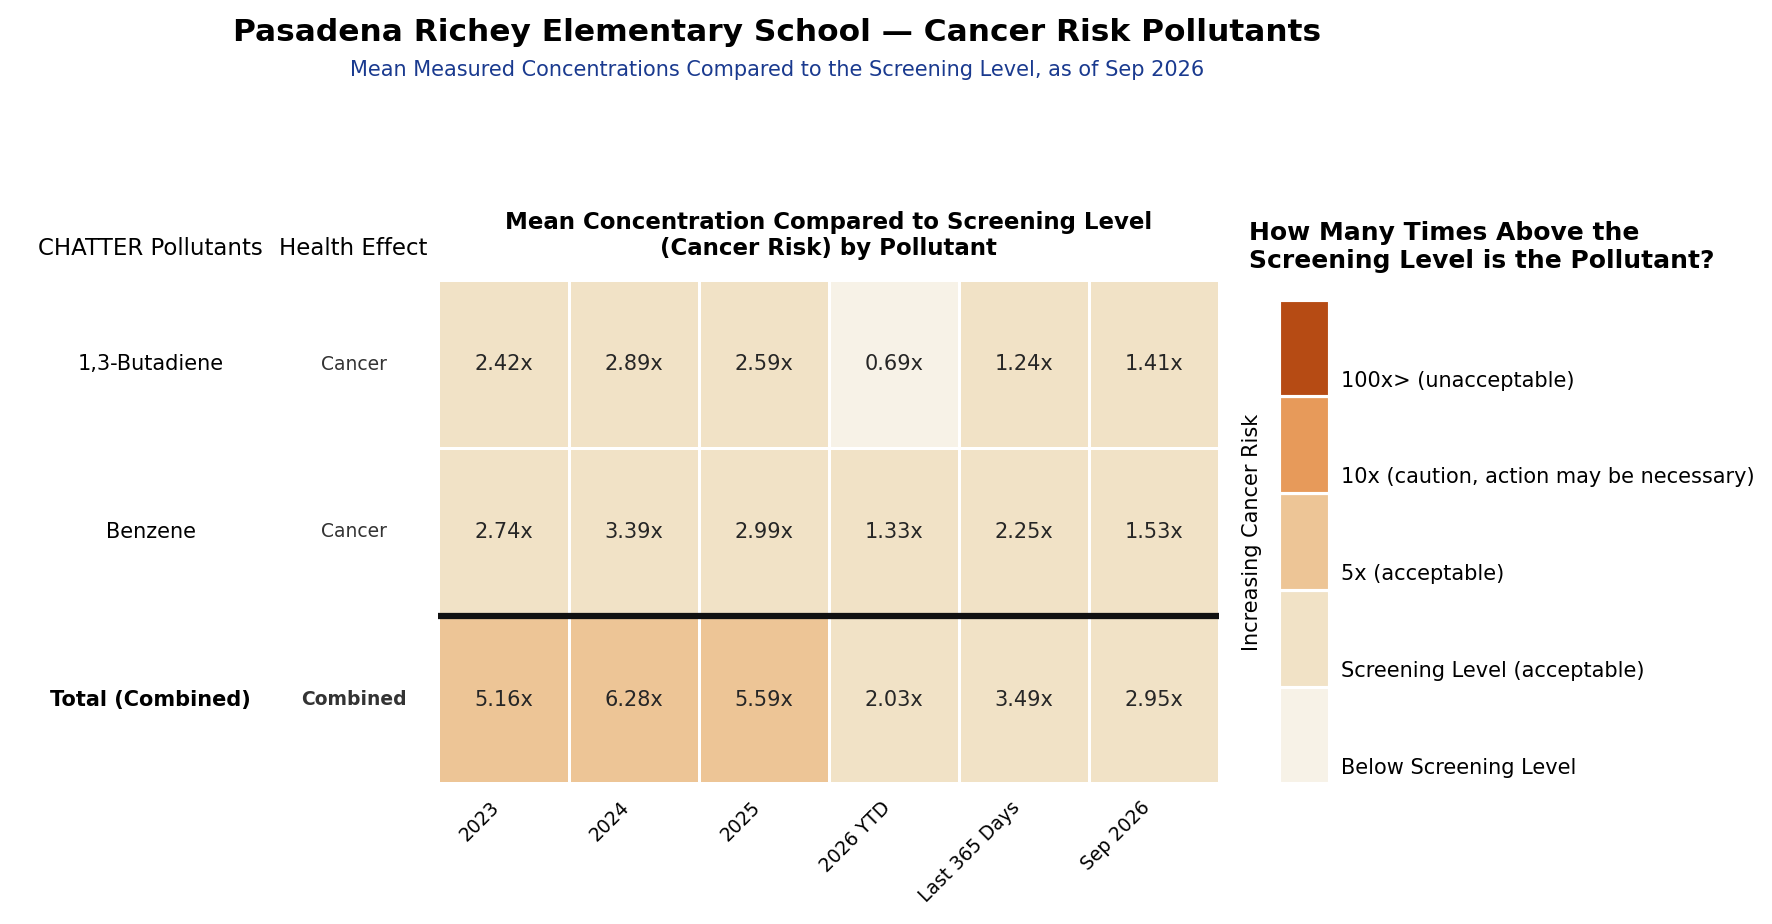
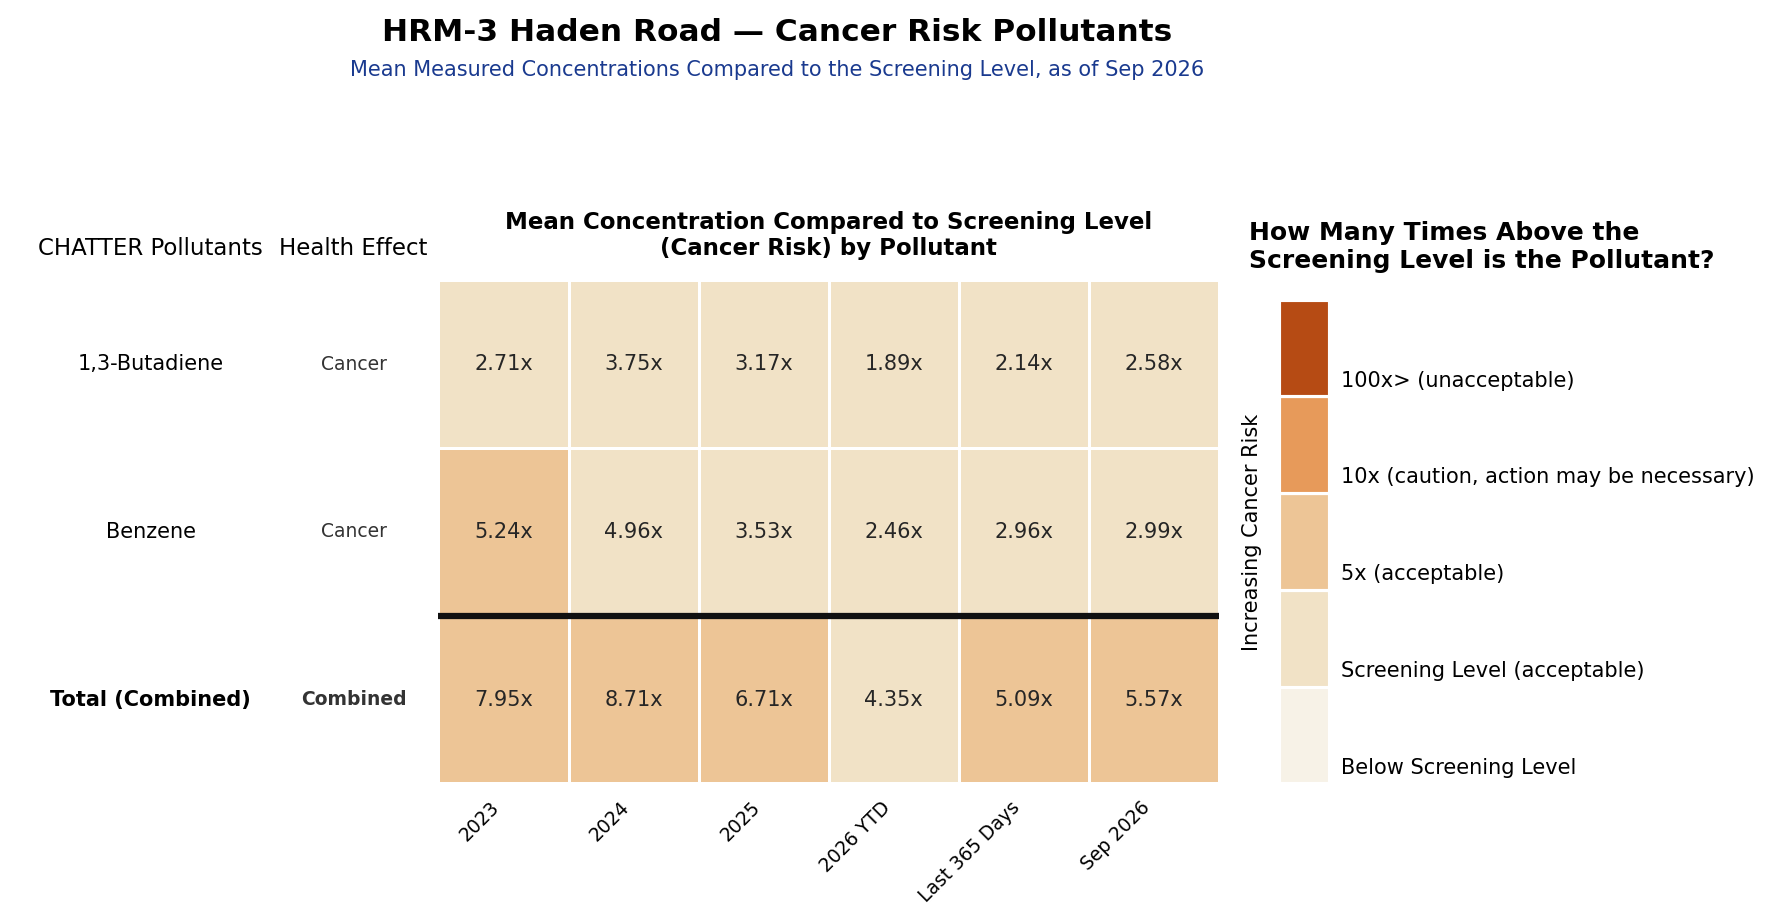
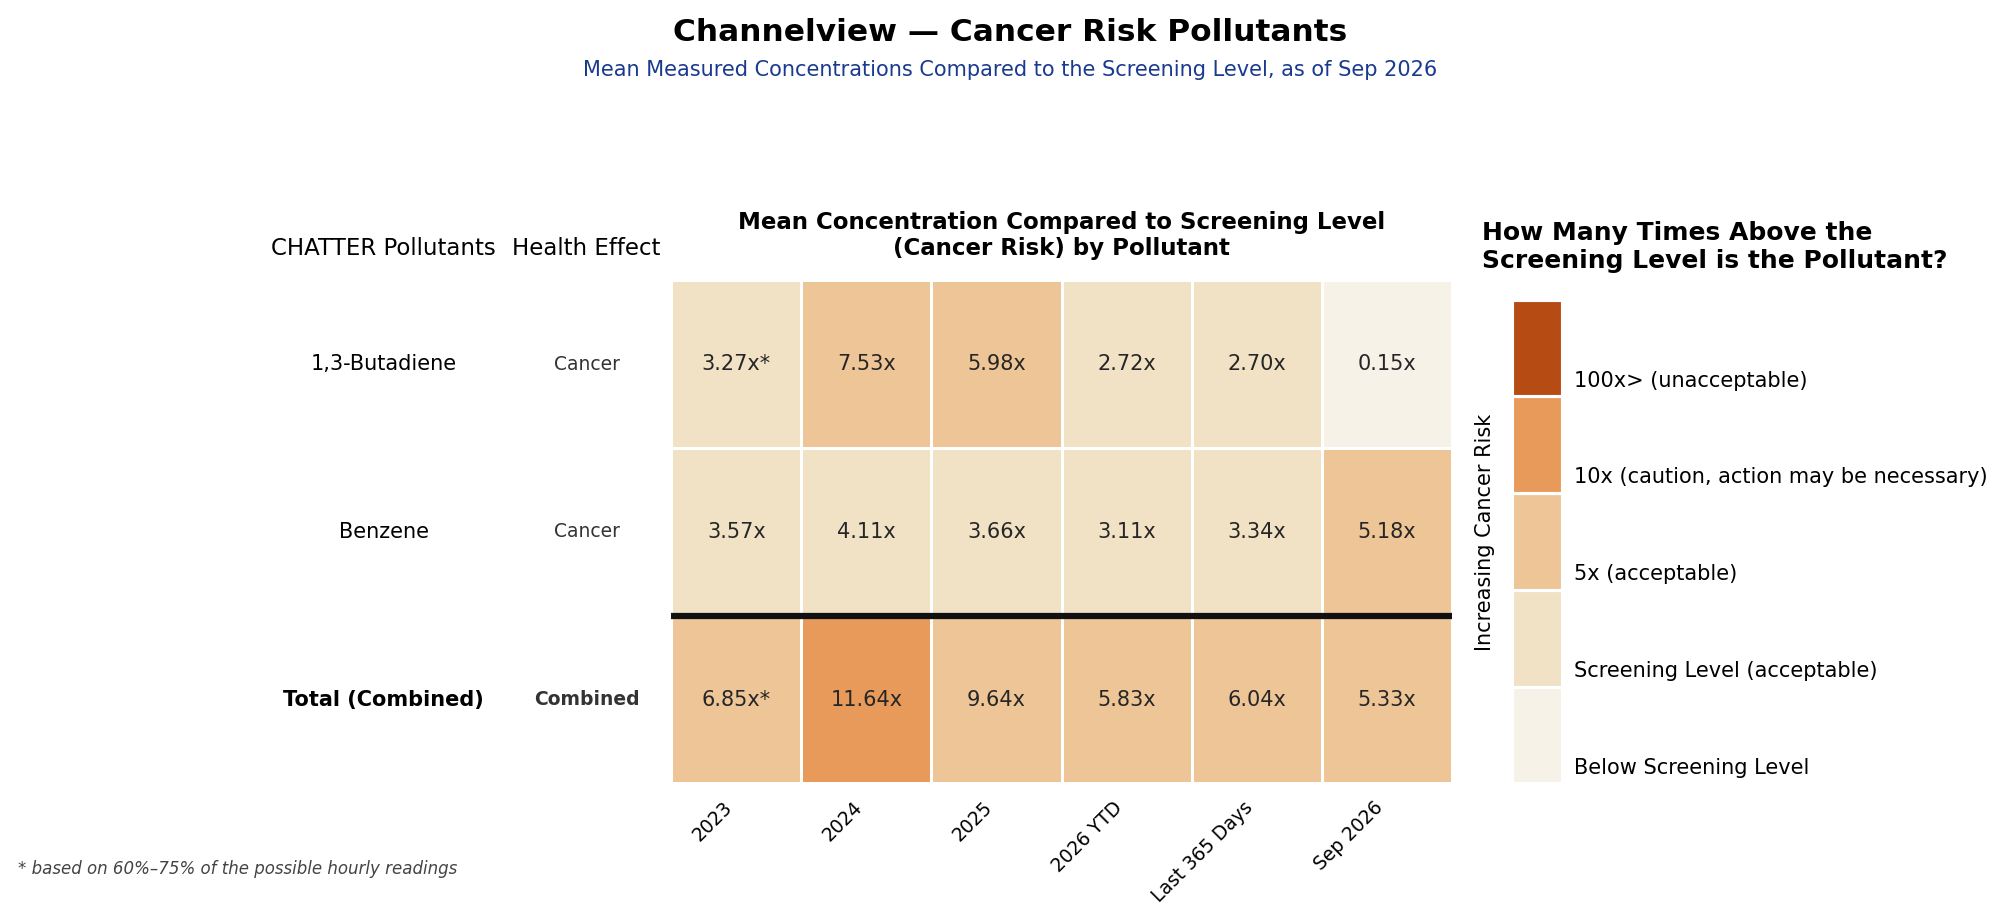
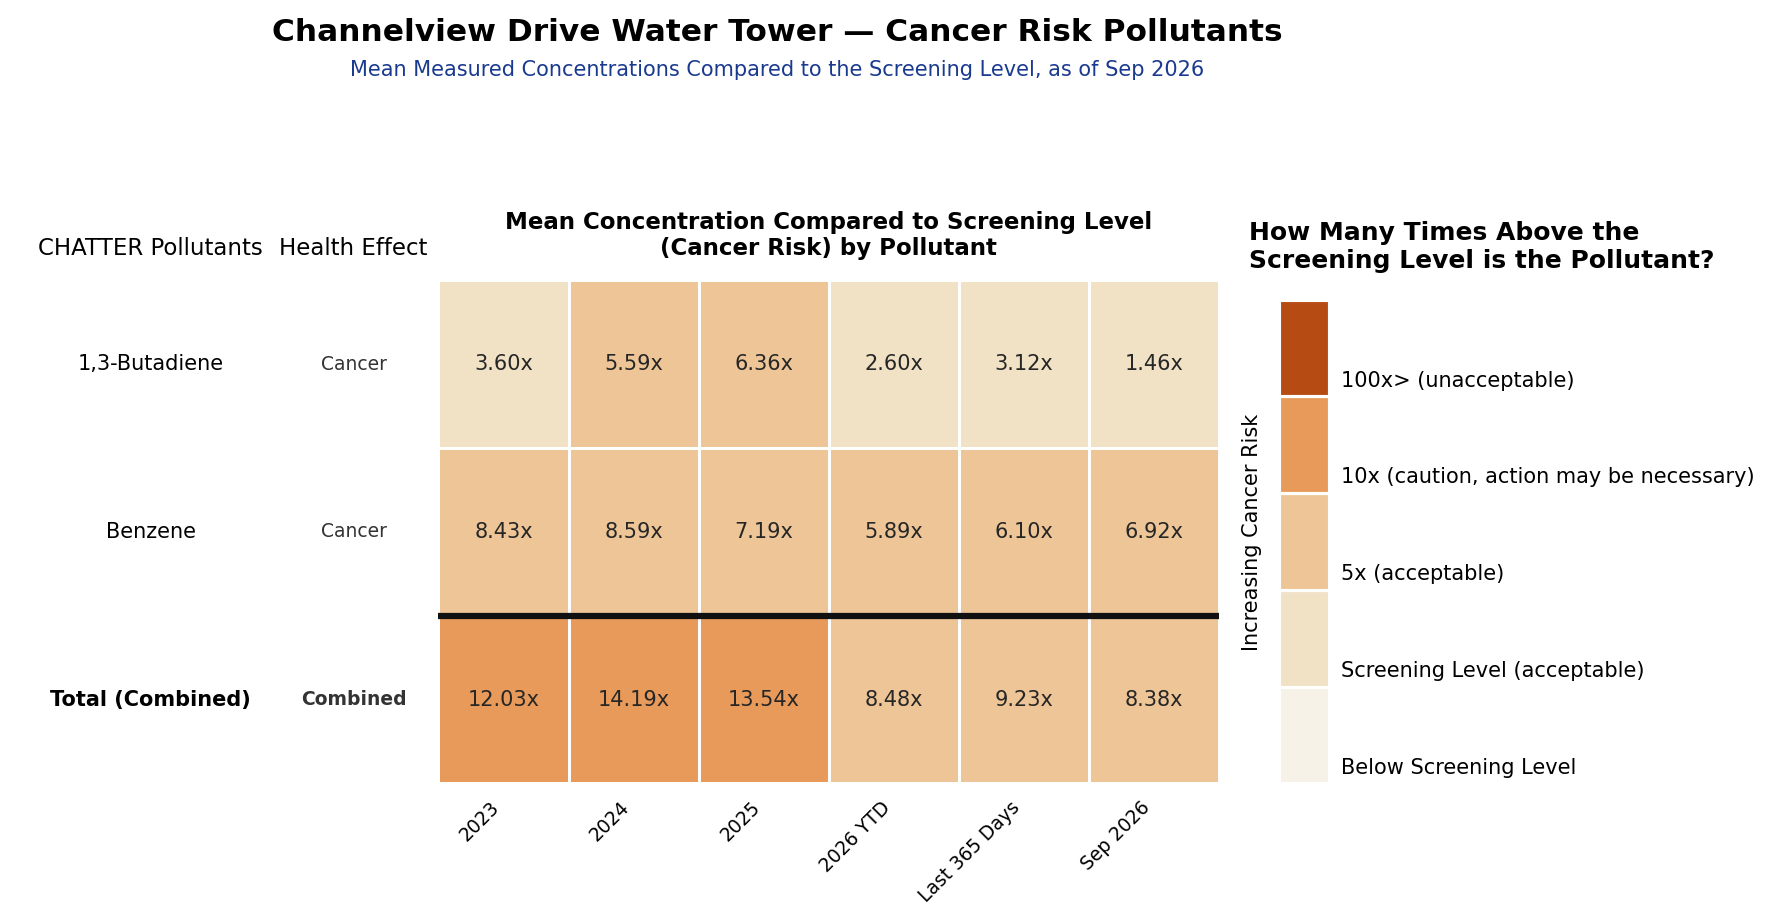
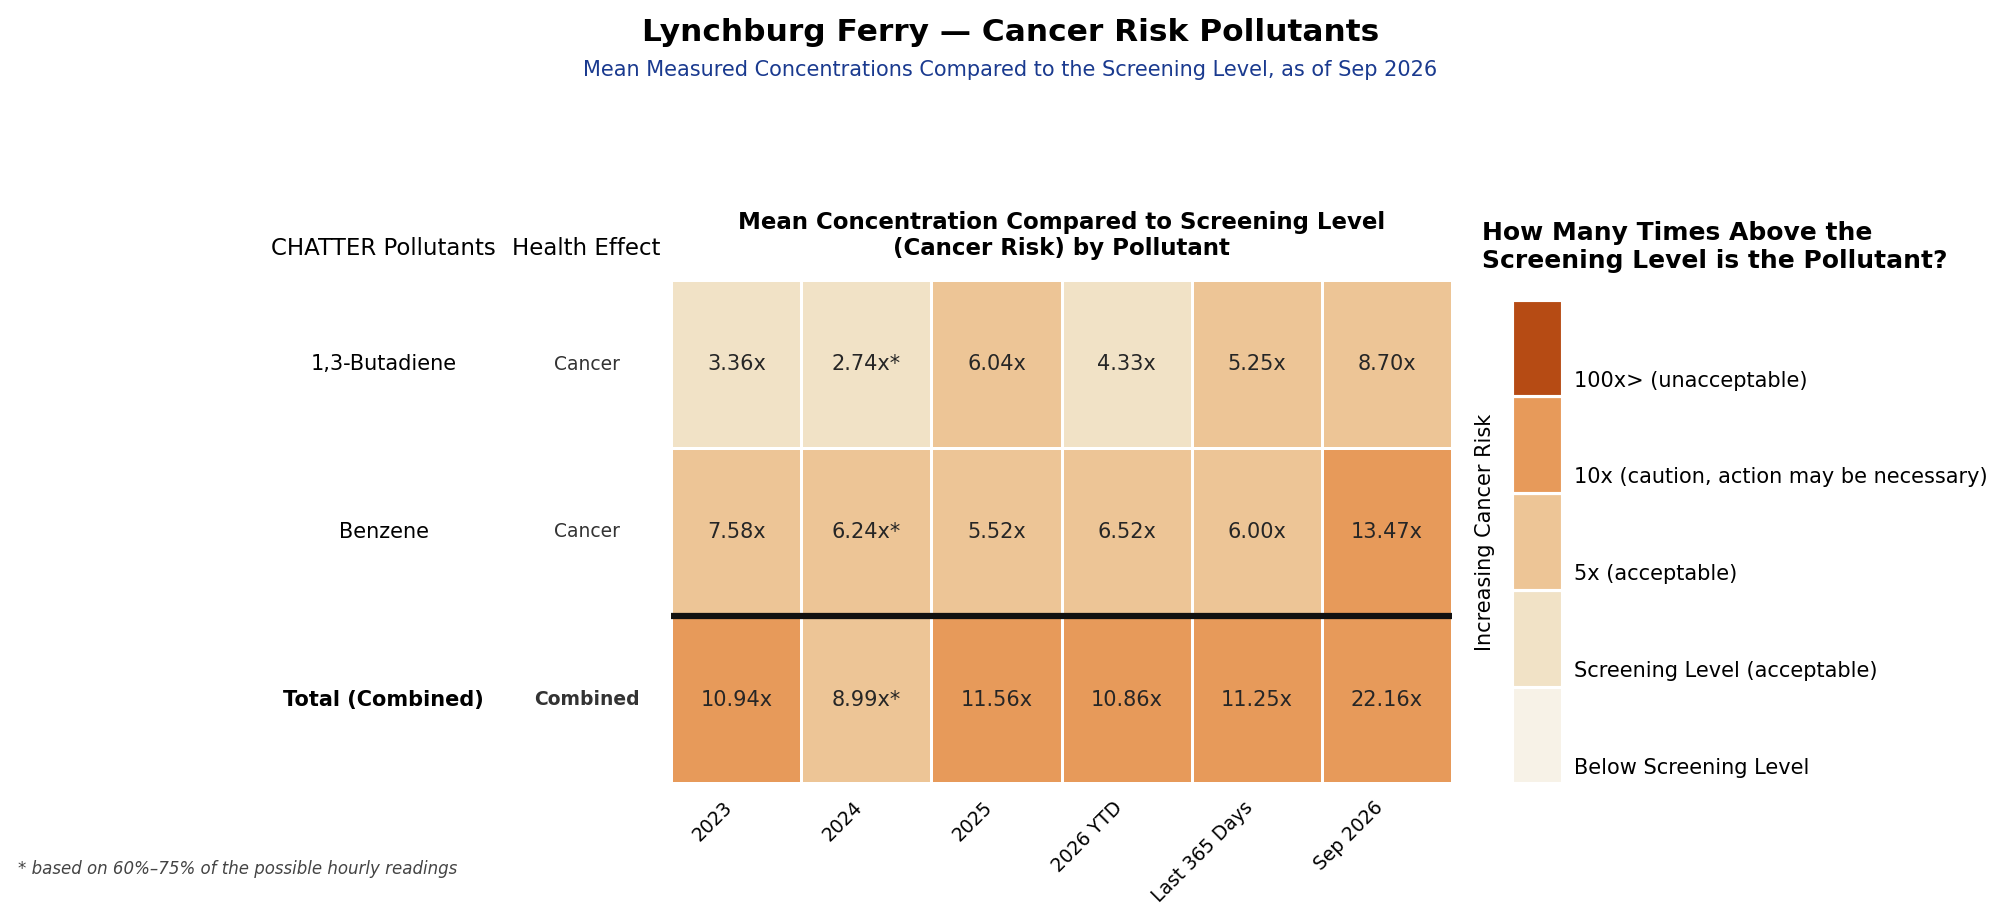
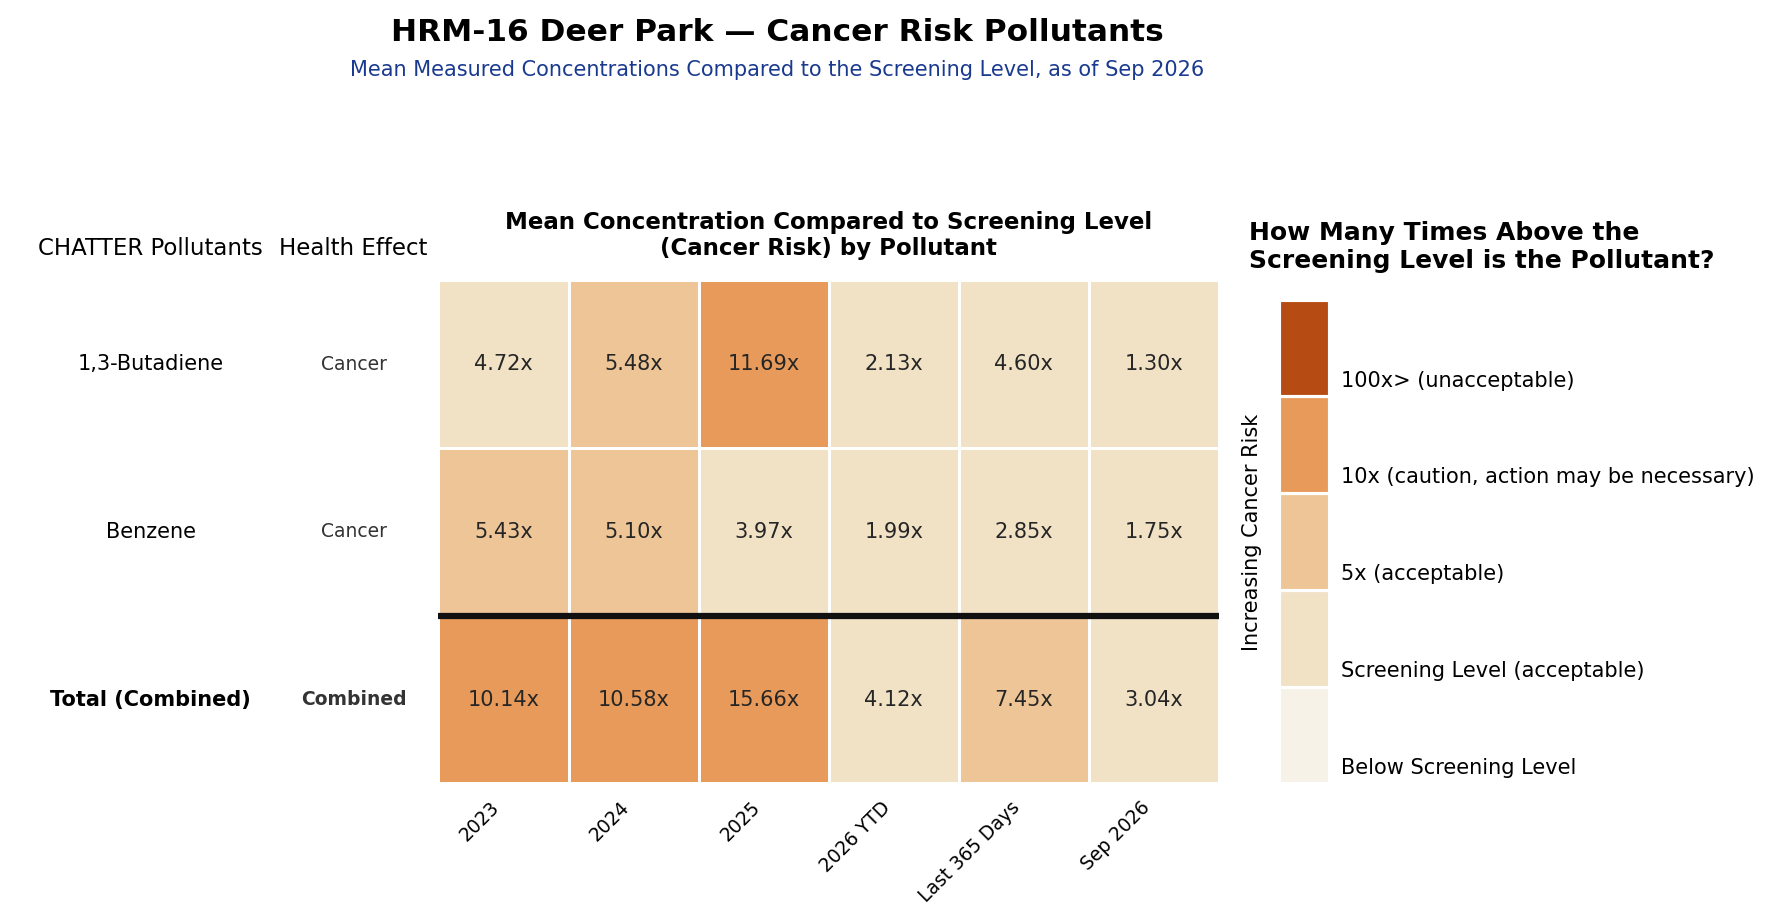
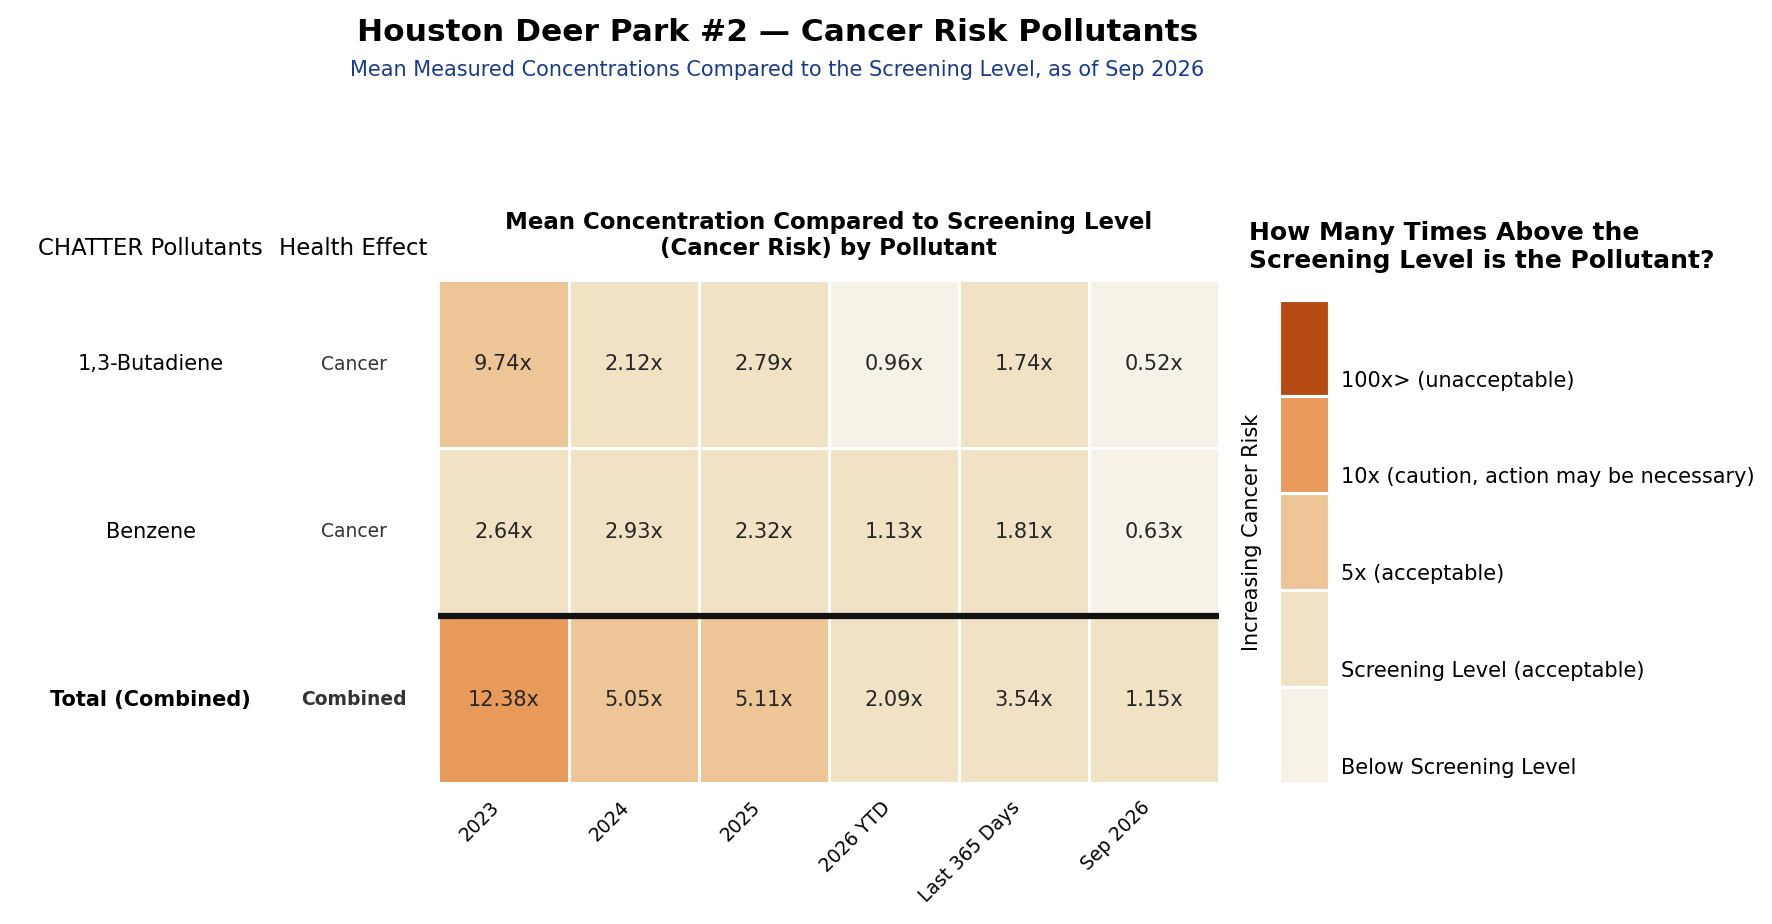
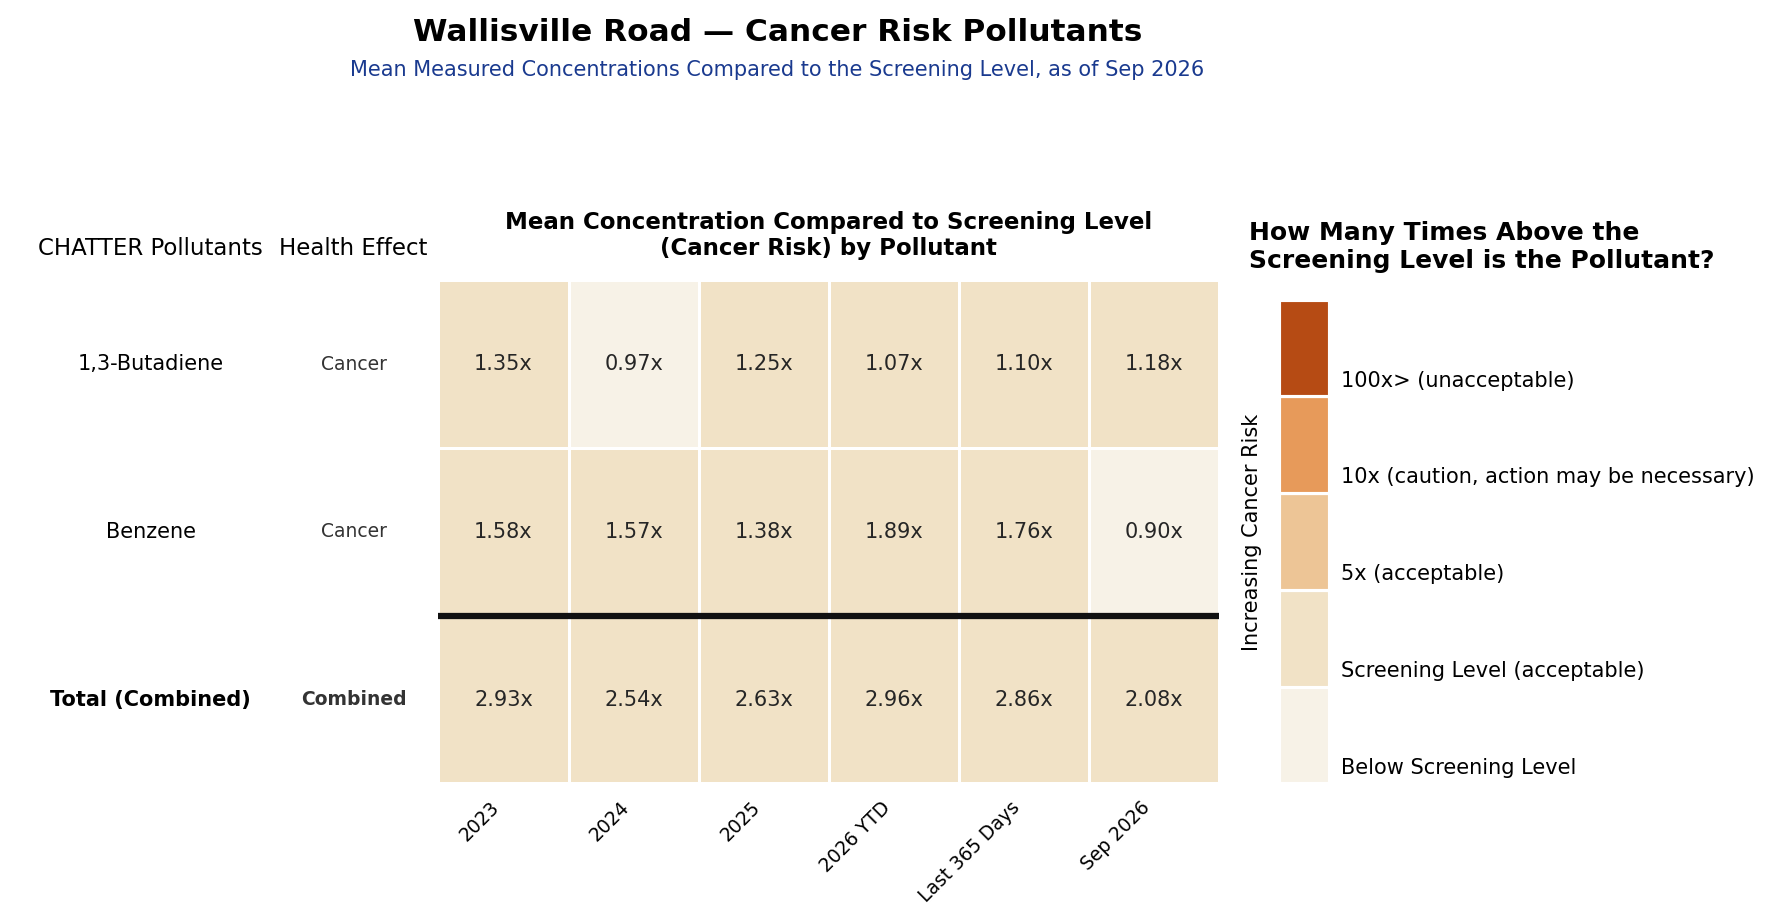
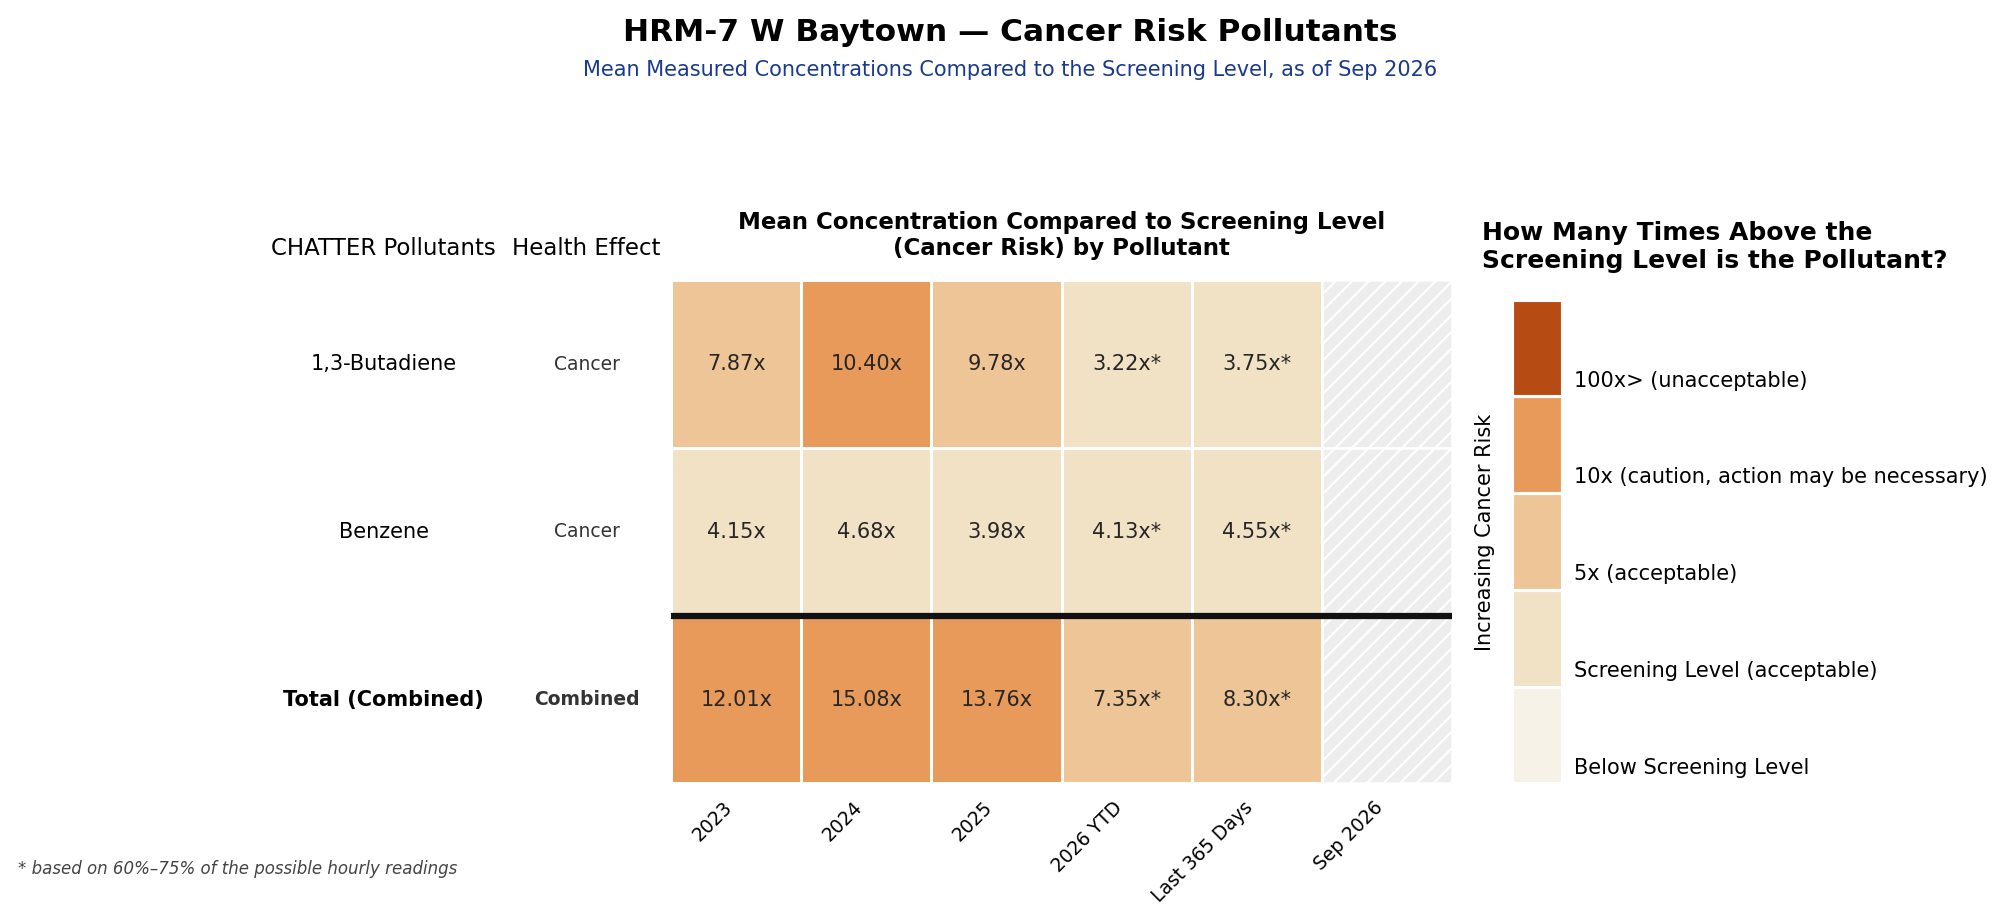
Cancer risk pollutants are air pollutants that increase the lifetime risk of developing cancer. Each location lists every cancer risk pollutant measured at that site and its average concentration as a multiple of the Screening Level. The bottom Total (Combined) row sums the pollutant risks, matching the combined cancer total reported on the main dashboard.
A value below 1.00x is below the screening level.
CHATTER analyzes air pollutants measured with automatic gas chromatograph (AutoGC) equipment. In Houston, CHATTER follows all fourteen hourly AutoGC monitors in Harris County — Clinton, Manchester East Avenue N, Houston Milby Park and Cesar Chavez (East End); Galena Park and Pasadena Richey Elementary School (Galena Park / Pasadena); HRM-3 Haden Road (Jacinto City / Cloverleaf); Channelview, Channelview Drive Water Tower and Lynchburg Ferry (Channelview / Lynchburg); HRM-16 Deer Park and Houston Deer Park #2 (Deer Park); and Wallisville Road and HRM-7 W Baytown (Baytown) — grouped into the six sections of the monitor map. Each section below is a tabbed card: click a monitor’s name to see its heatmap.
How to read this plot (click to expand)
Each row is a cancer risk pollutant, with its health effect listed beside it. Each column is a period of time — the calendar years, the year so far (2026 YTD), the most recent 365 days, and the most recent month. The bottom row, Total (Combined), adds the pollutants together for that period.
The number in each square is the measured level divided by the Screening Level, written as a multiple with an “x.” An asterisk after a number means that period had between 60% and 75% of its possible hourly readings, so the average rests on thinner data; periods below 60% are left blank.
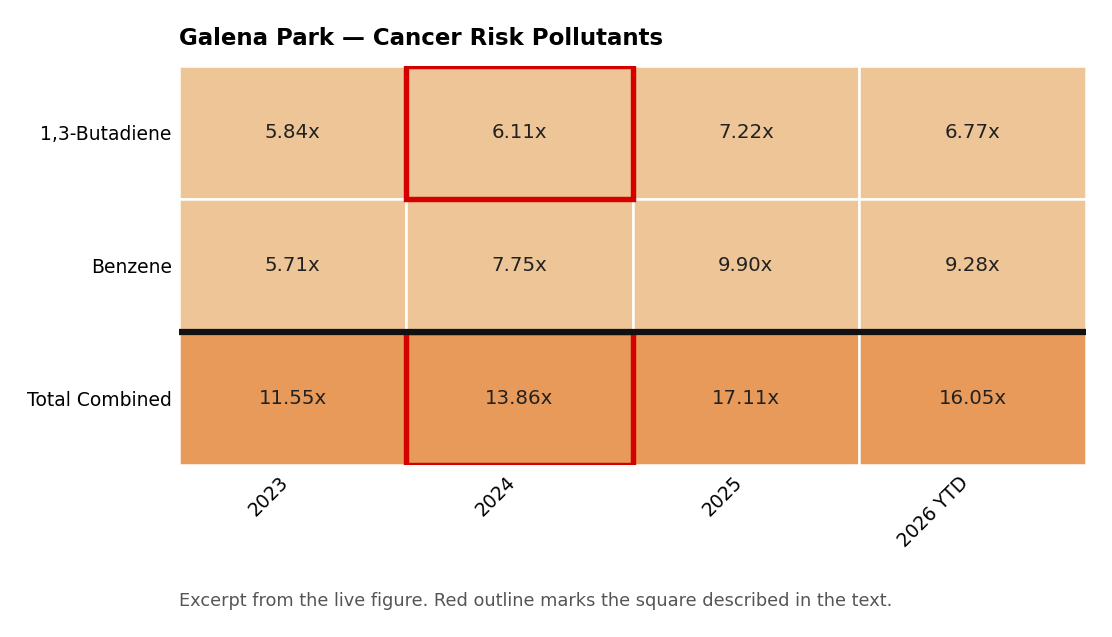
A clarifying example.In the Galena Park / Pasadena section, open the Galena Park tab and find the row for 1,3-Butadiene and the column for 2024. The square reads 6.11x. Breathing 1,3-butadiene increases the risk of cancer. That number means the average level of 1,3-butadiene in 2024 was about six times the screening level. Looking at the color scale on the right, the square falls in the band that begins at 5x — the range from five to ten times the screening level, which the scale labels acceptable, though well above the one-in-a-million screening level itself.
Squares paler than that band are closer to, or below, the screening level. In the same column, Galena Park’s Total (Combined) for 2024 is 13.86x: adding both cancer pollutants together, the combined level was nearly fourteen times the screening level, which moves it into the darker 10x (caution, action may be necessary) band.
For a general explanation of heat maps, see the Frequently Asked Questions.