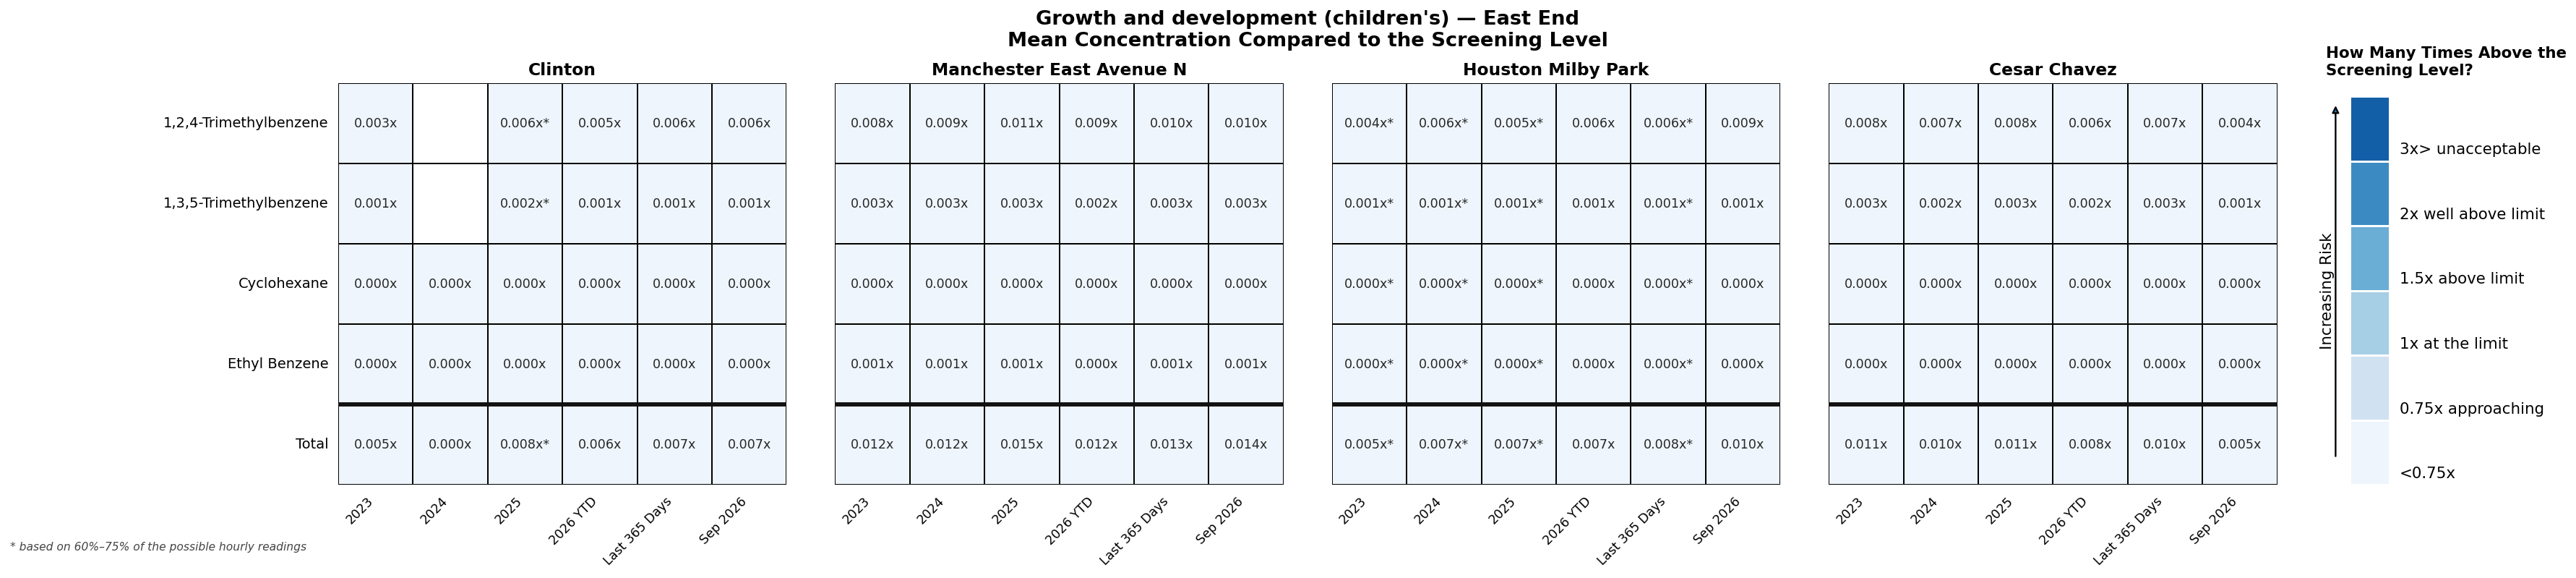
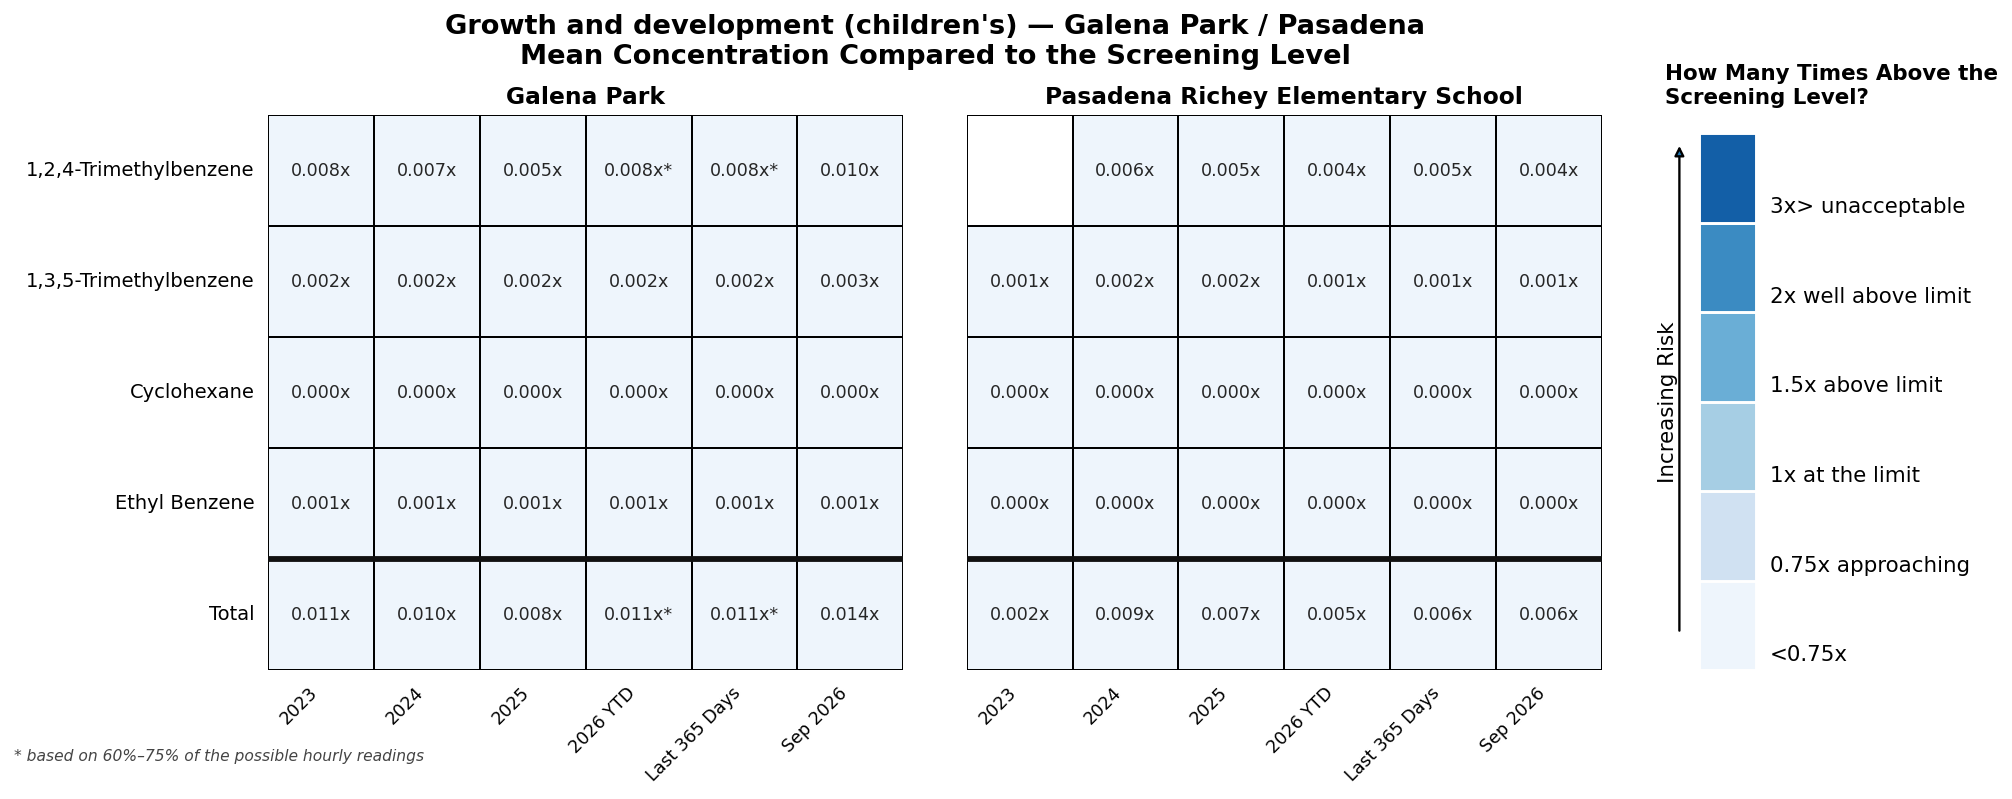
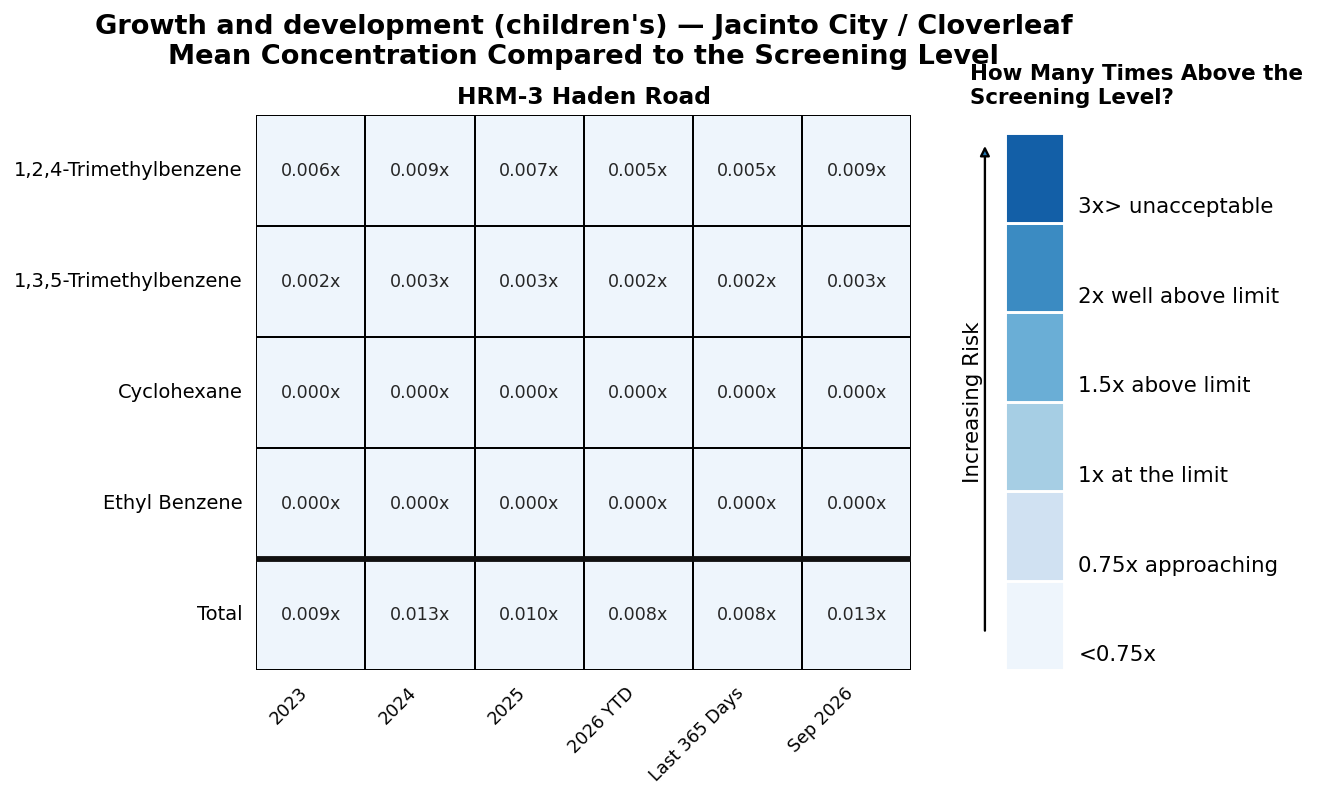
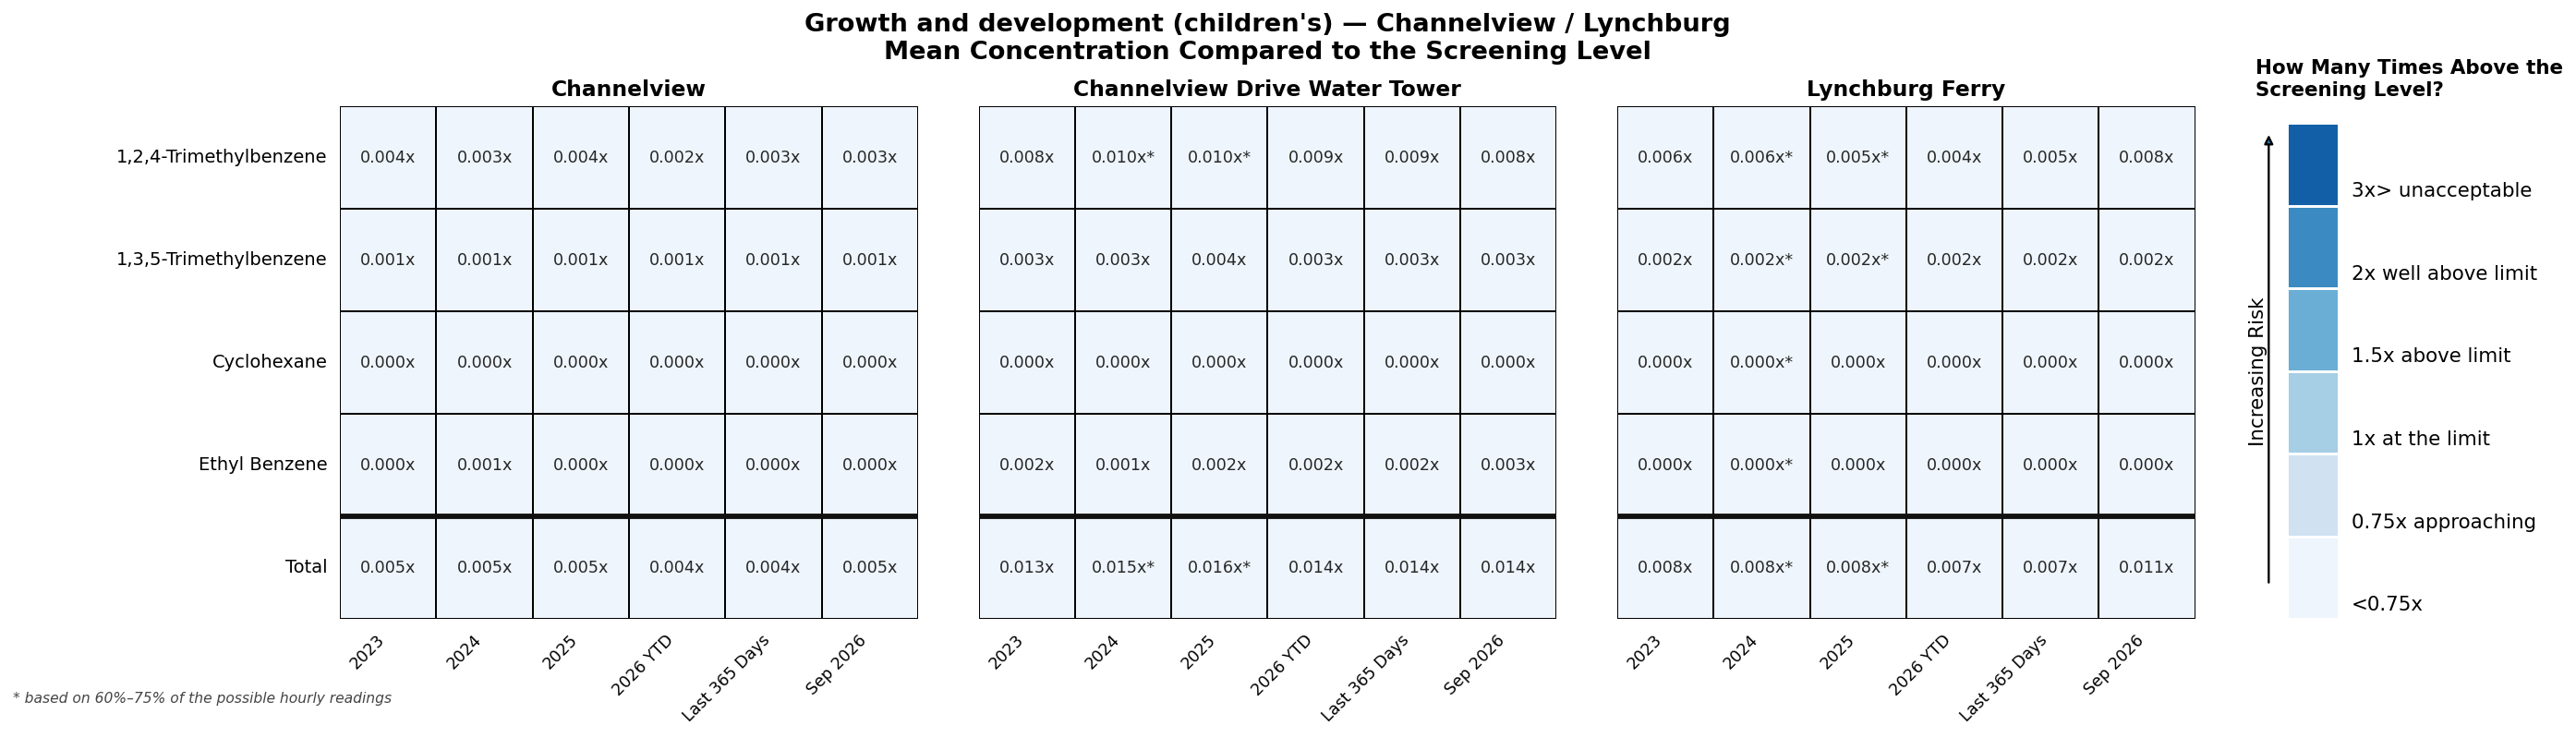
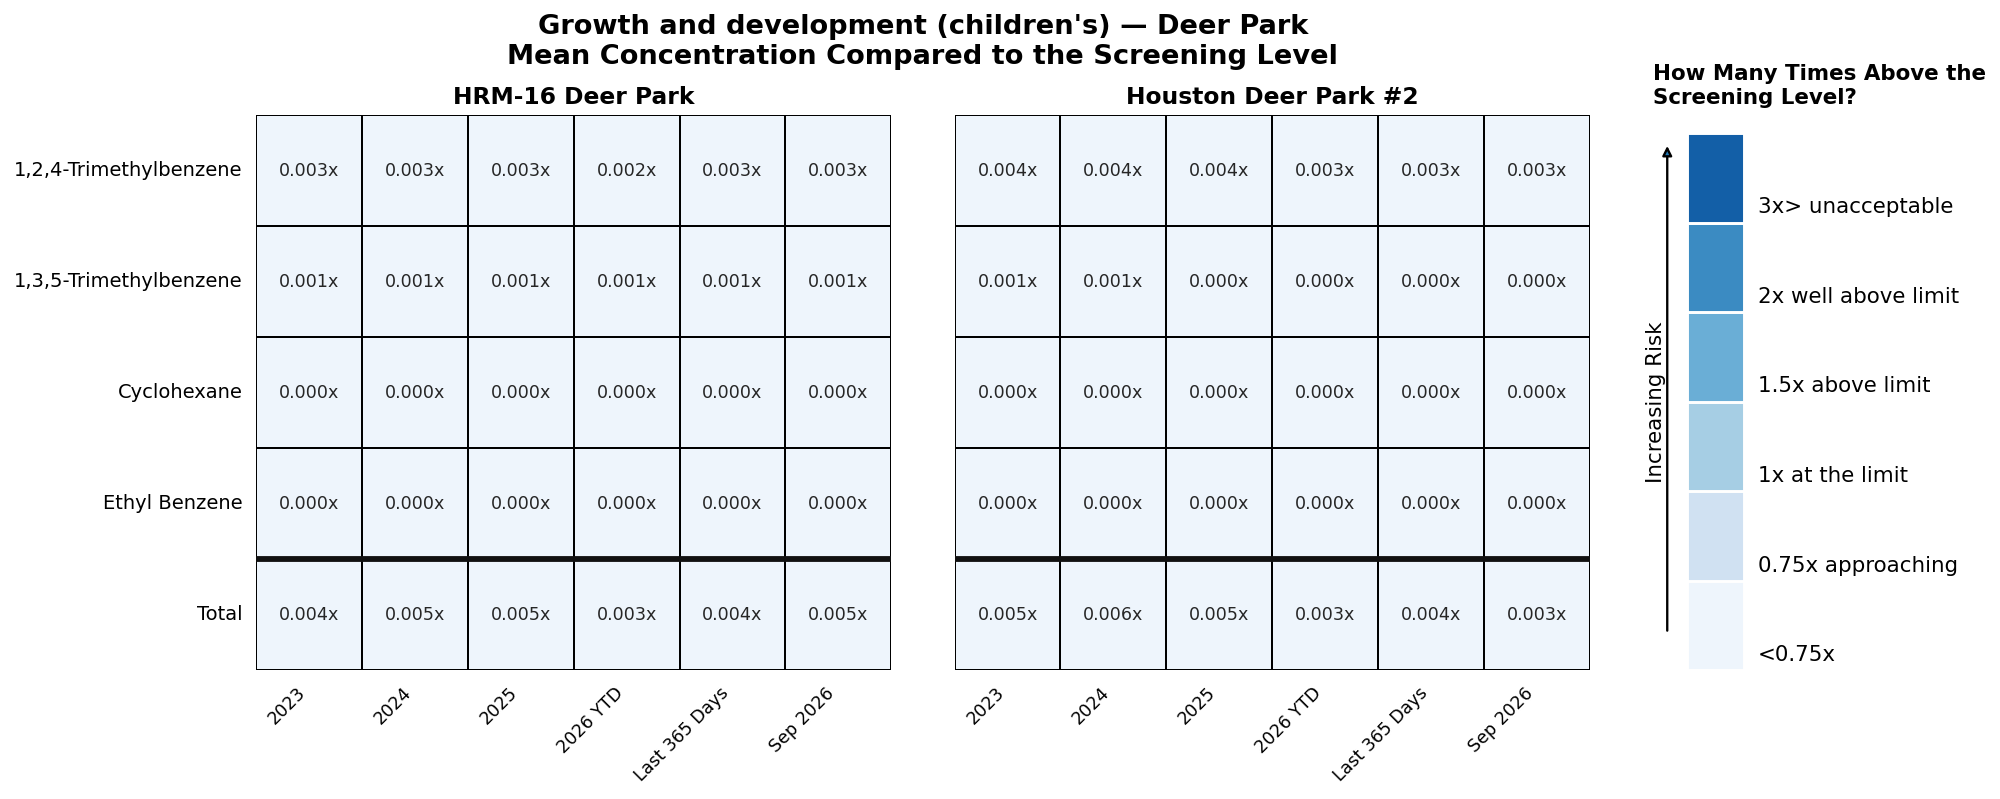
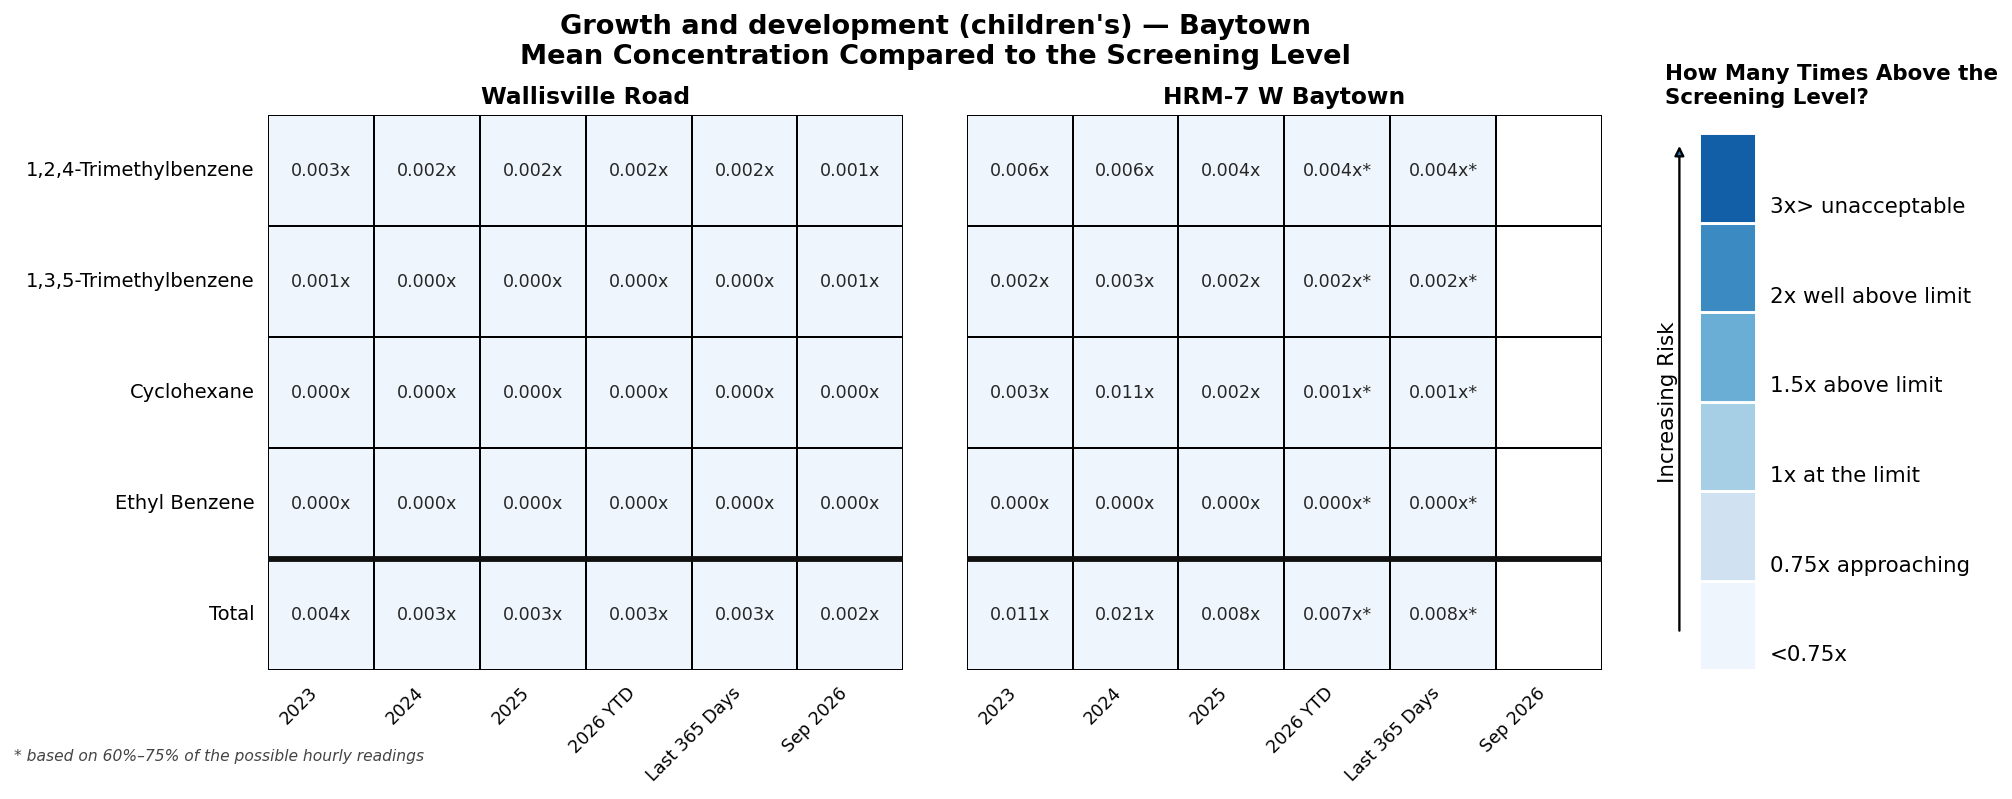
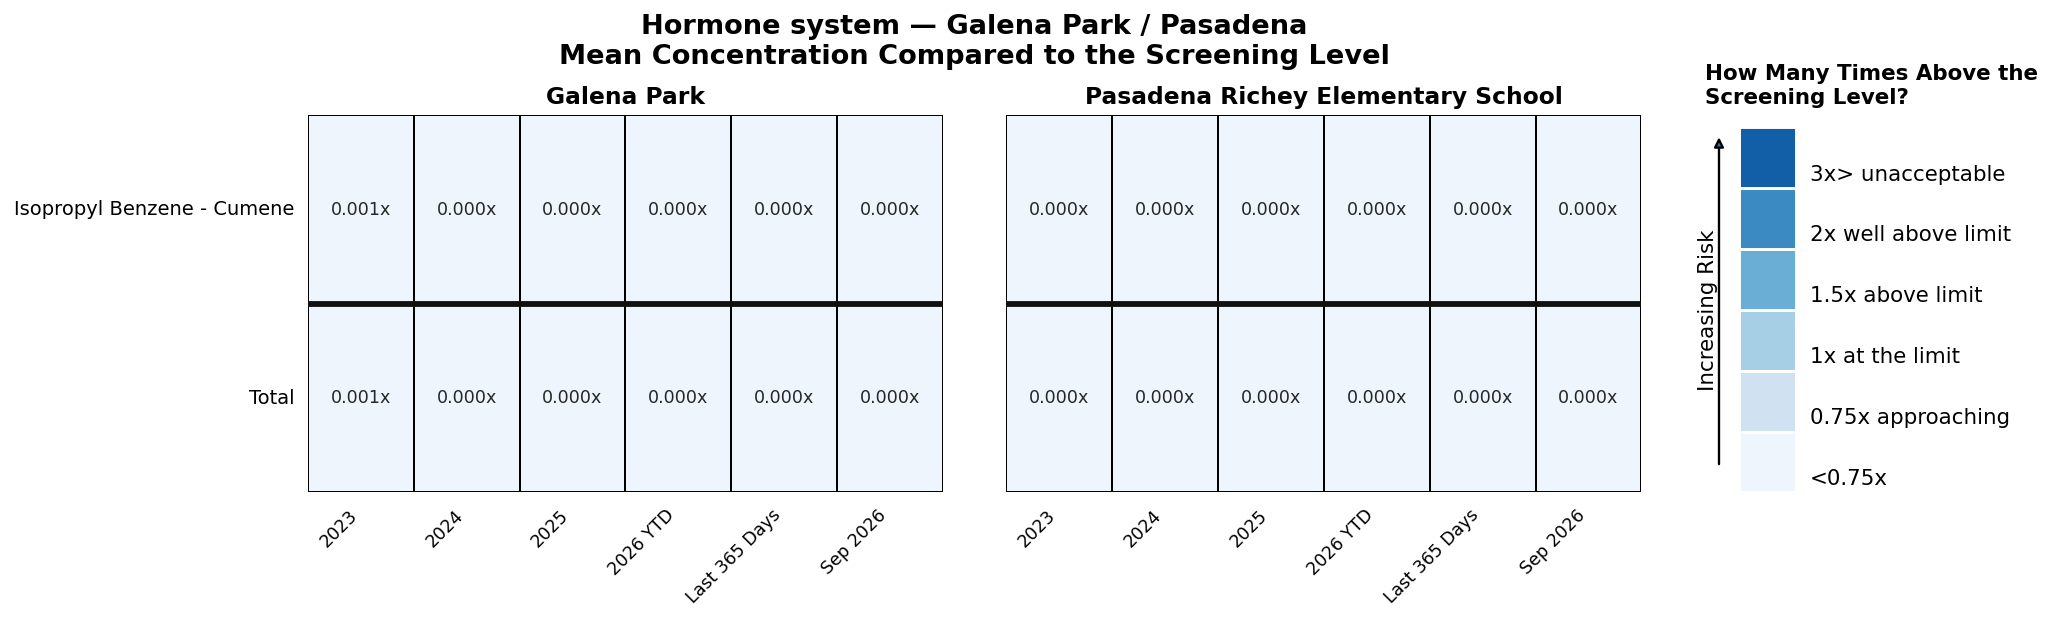
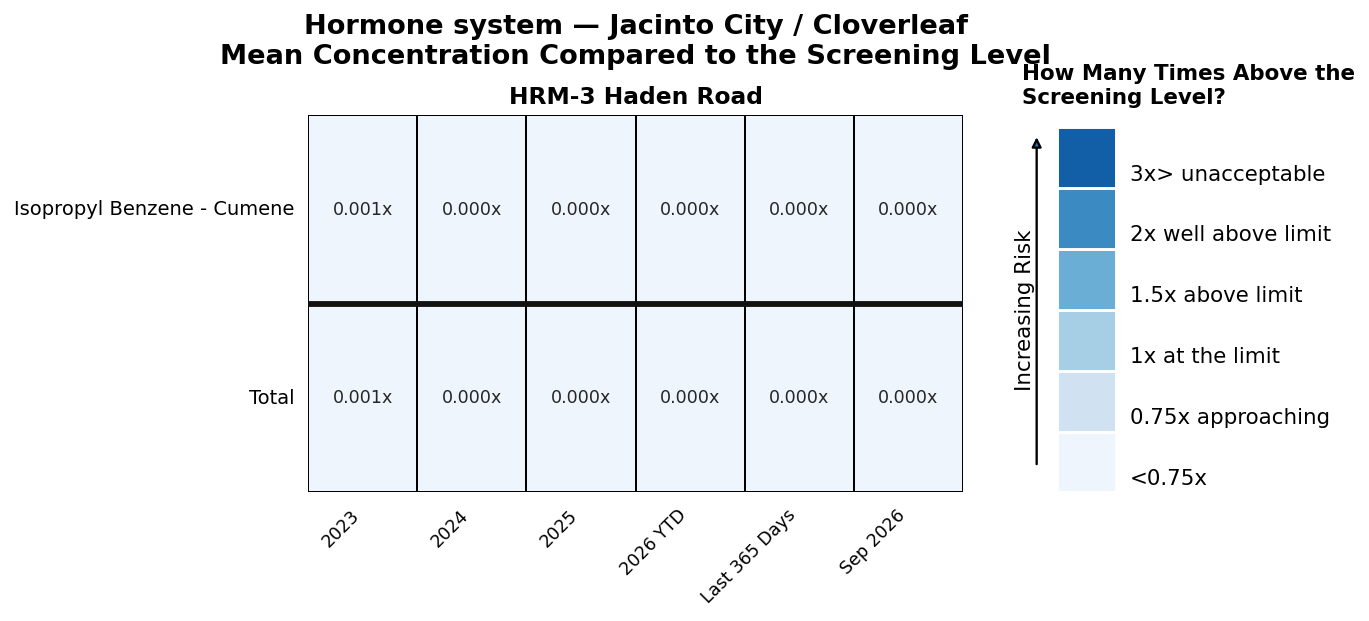
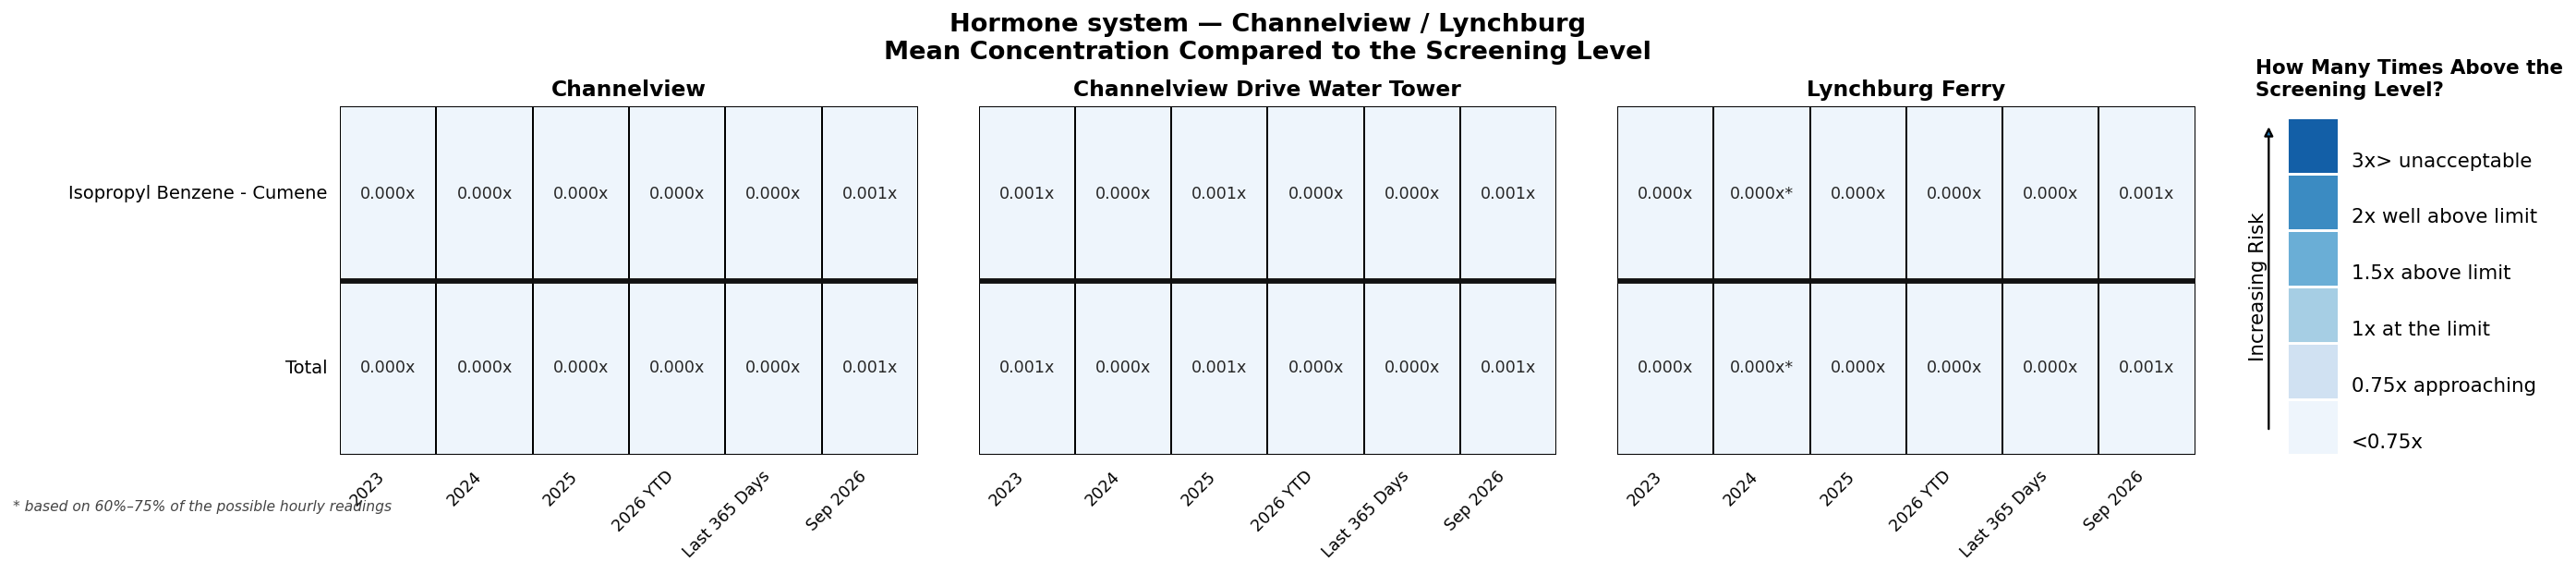
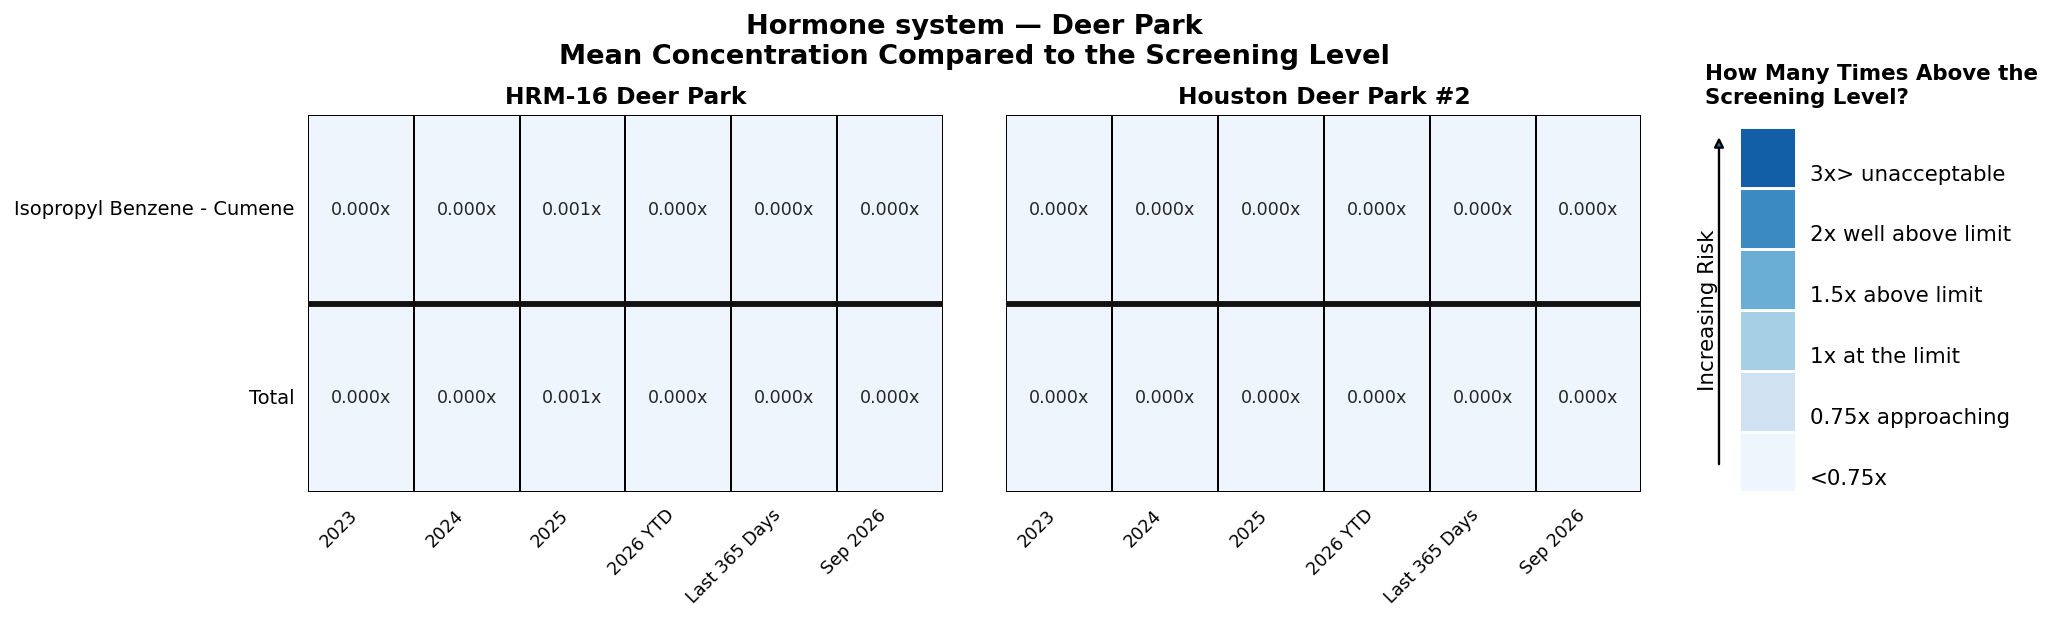
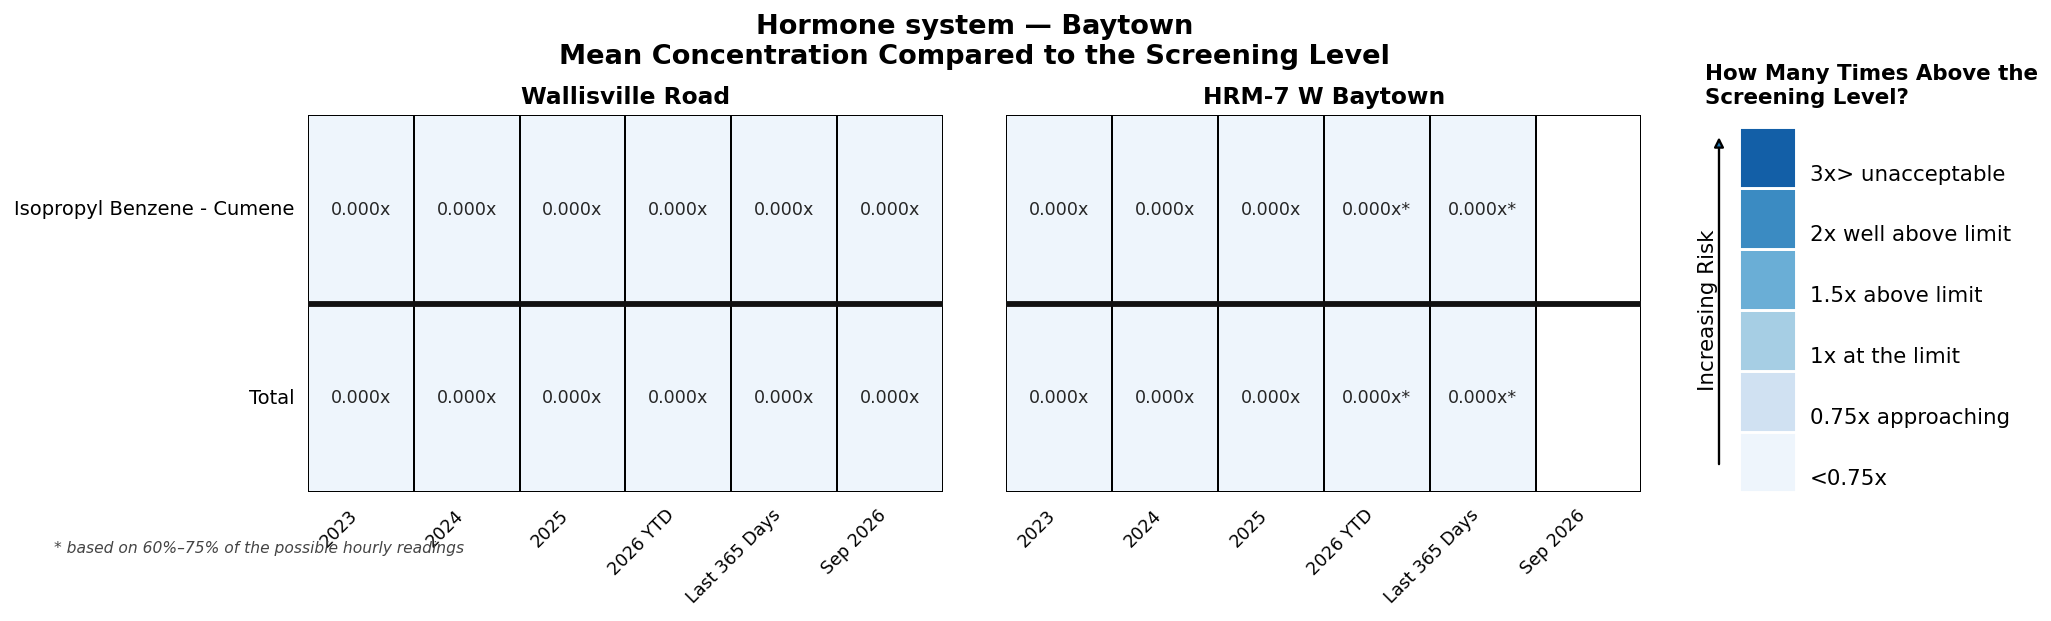
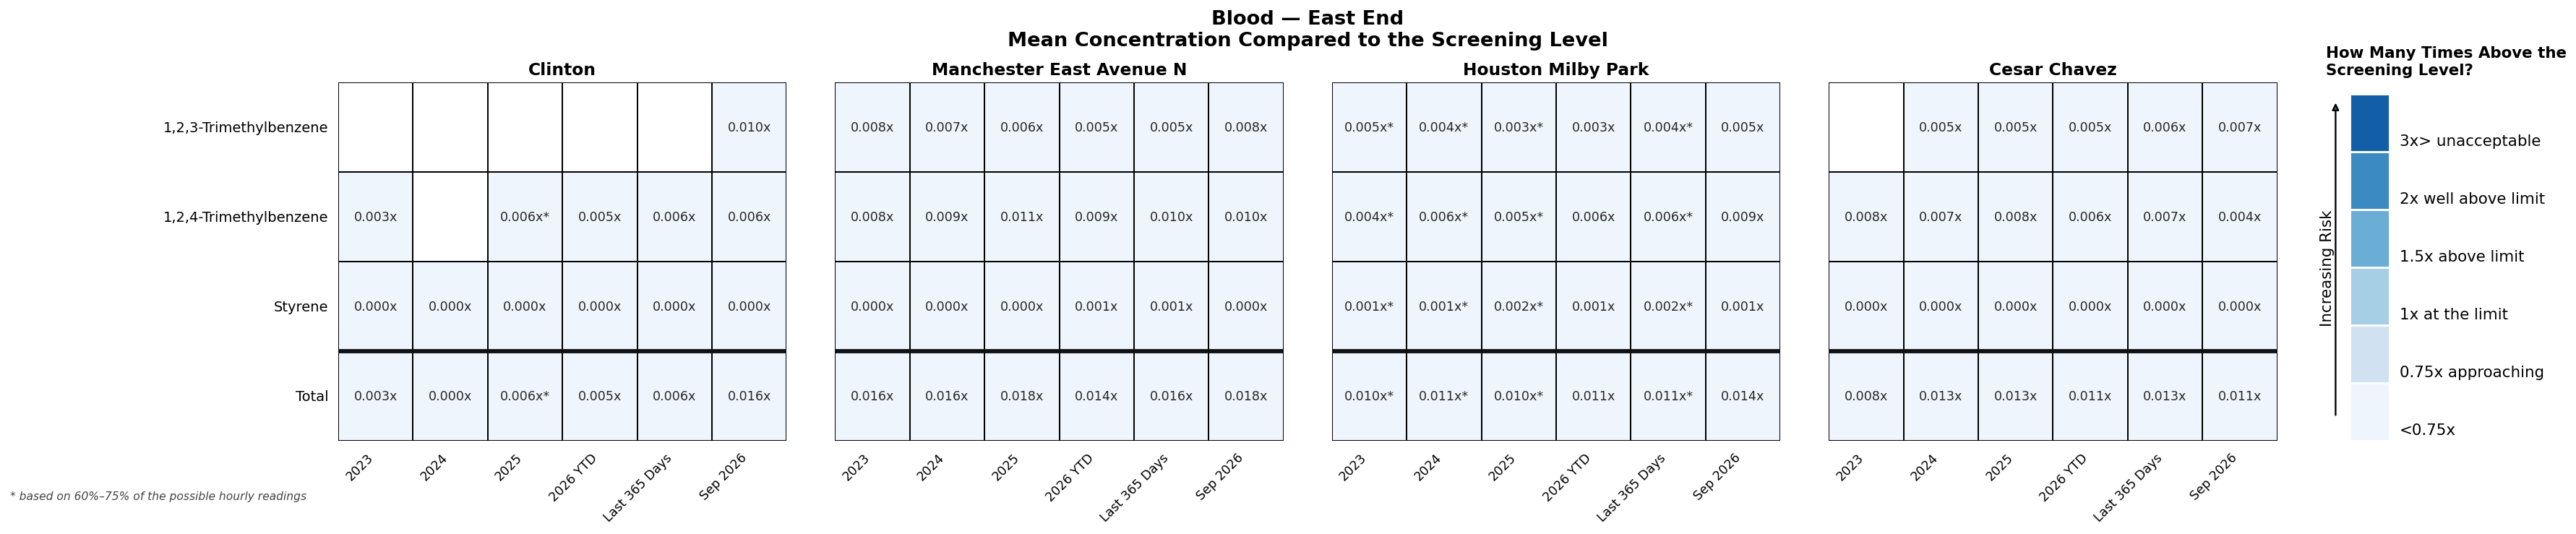
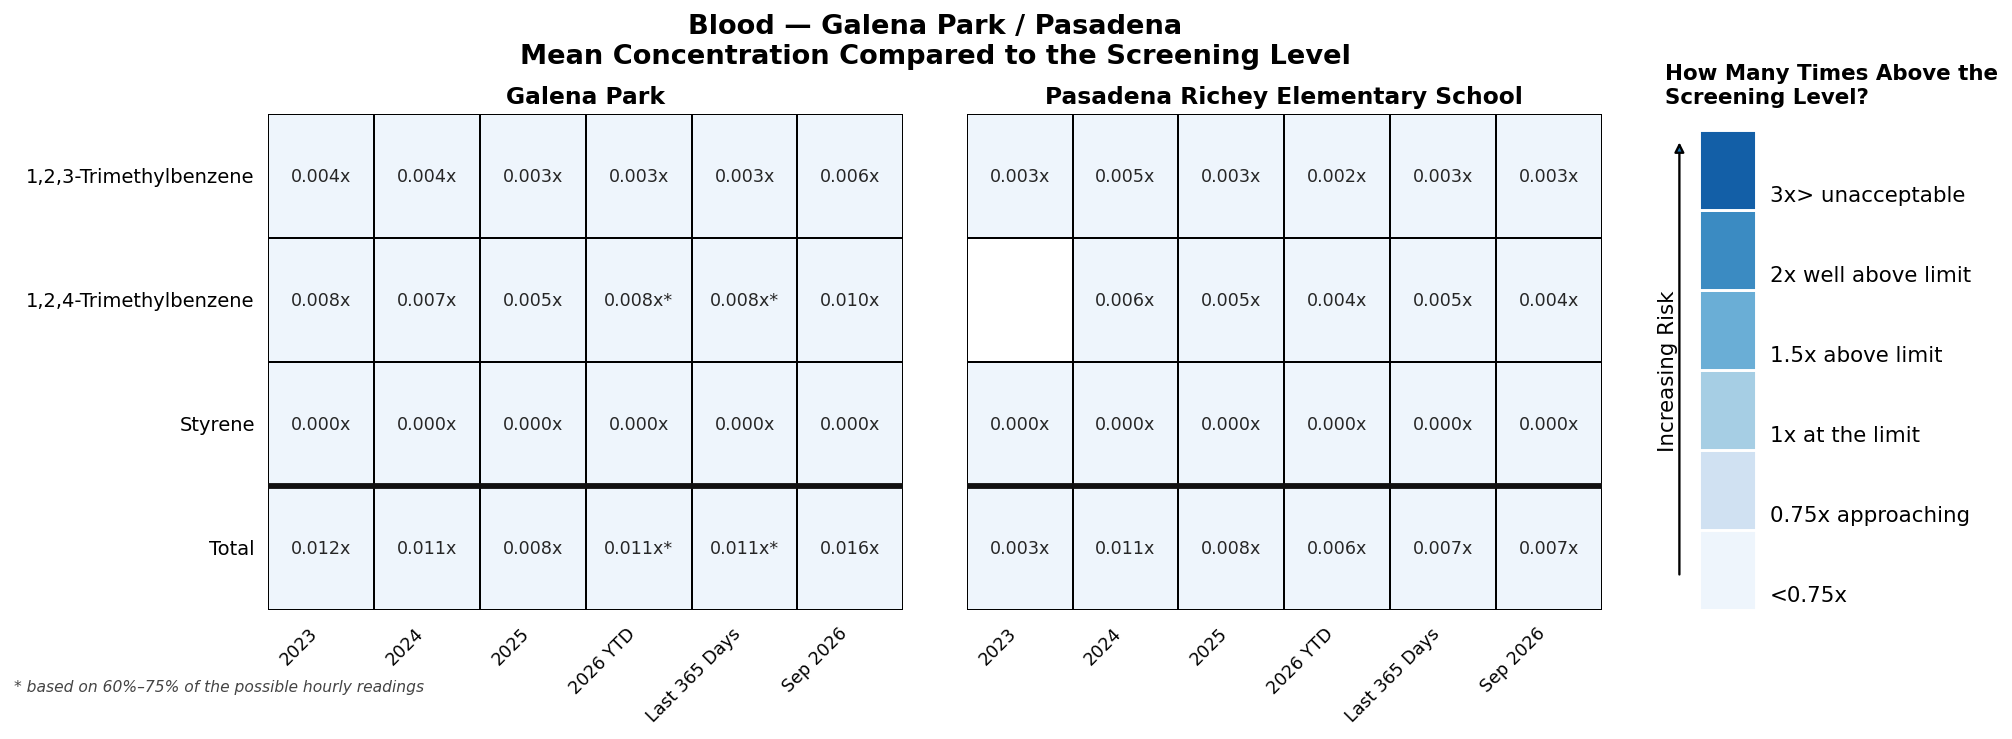
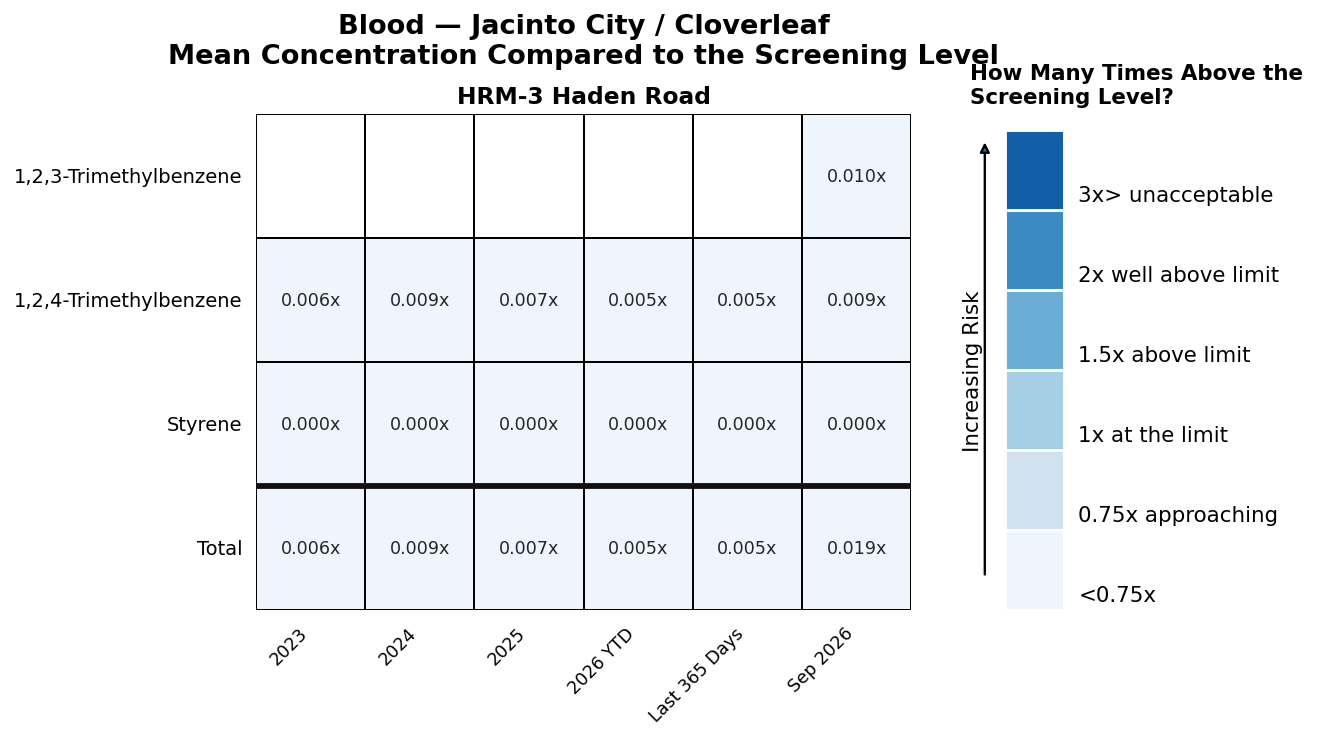
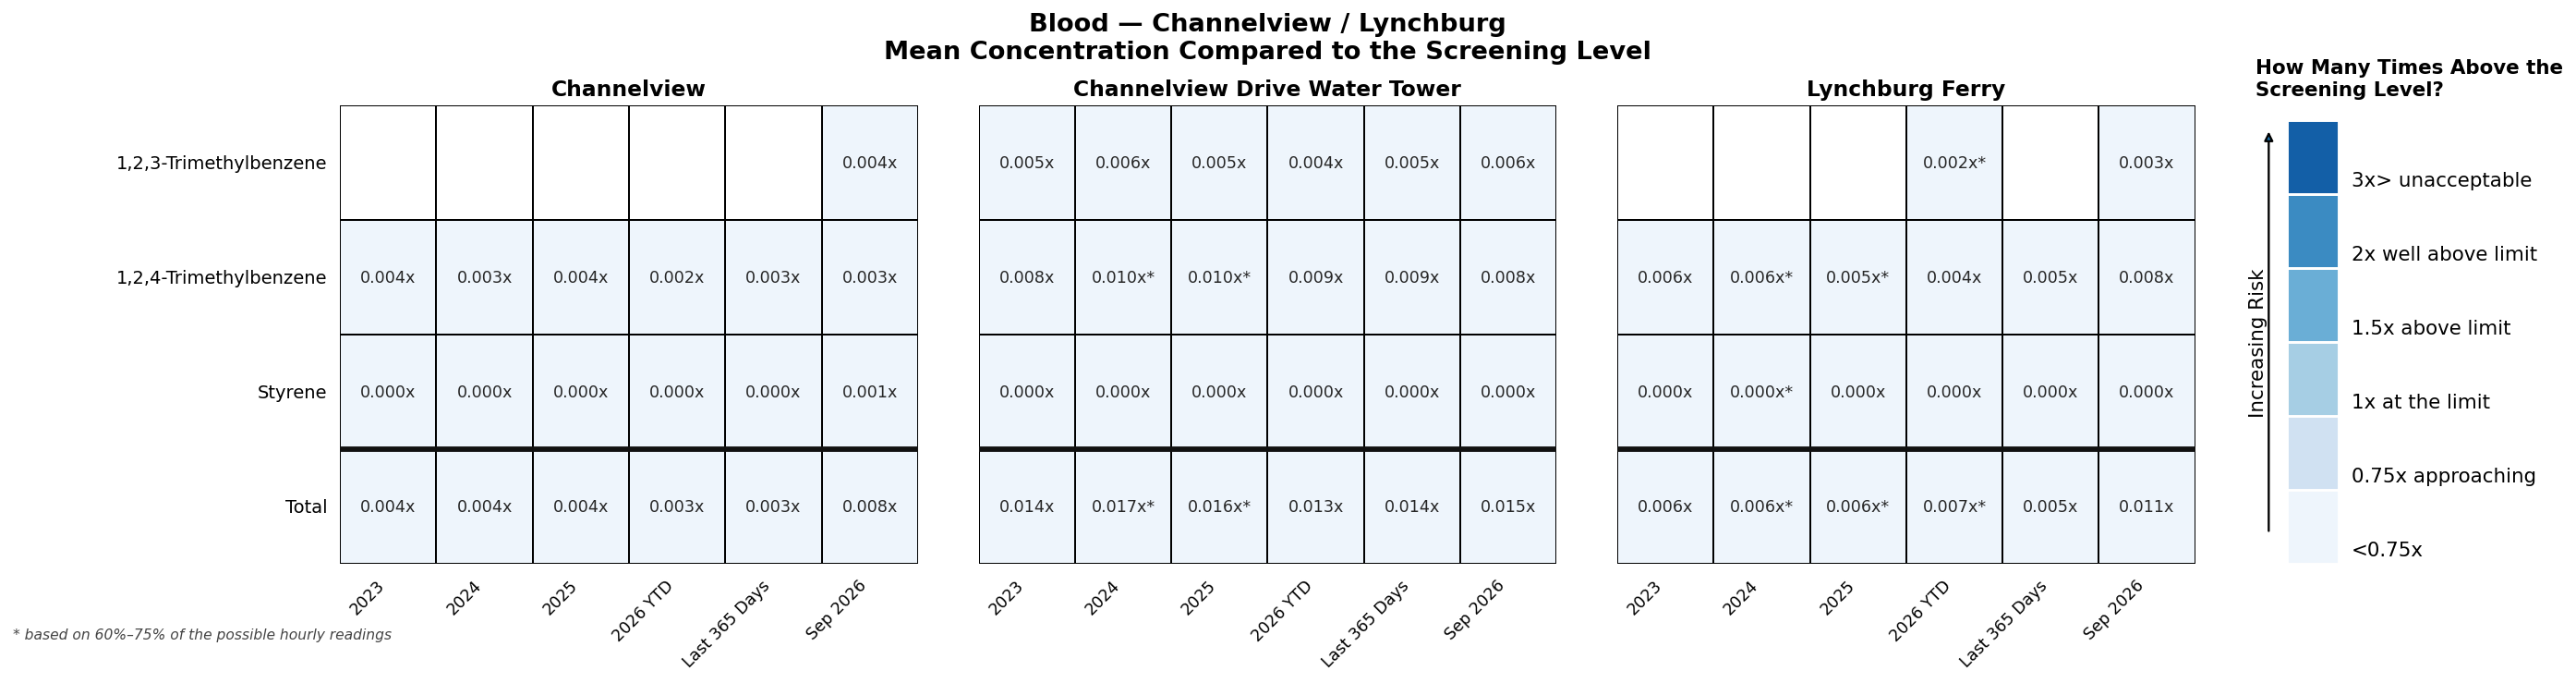
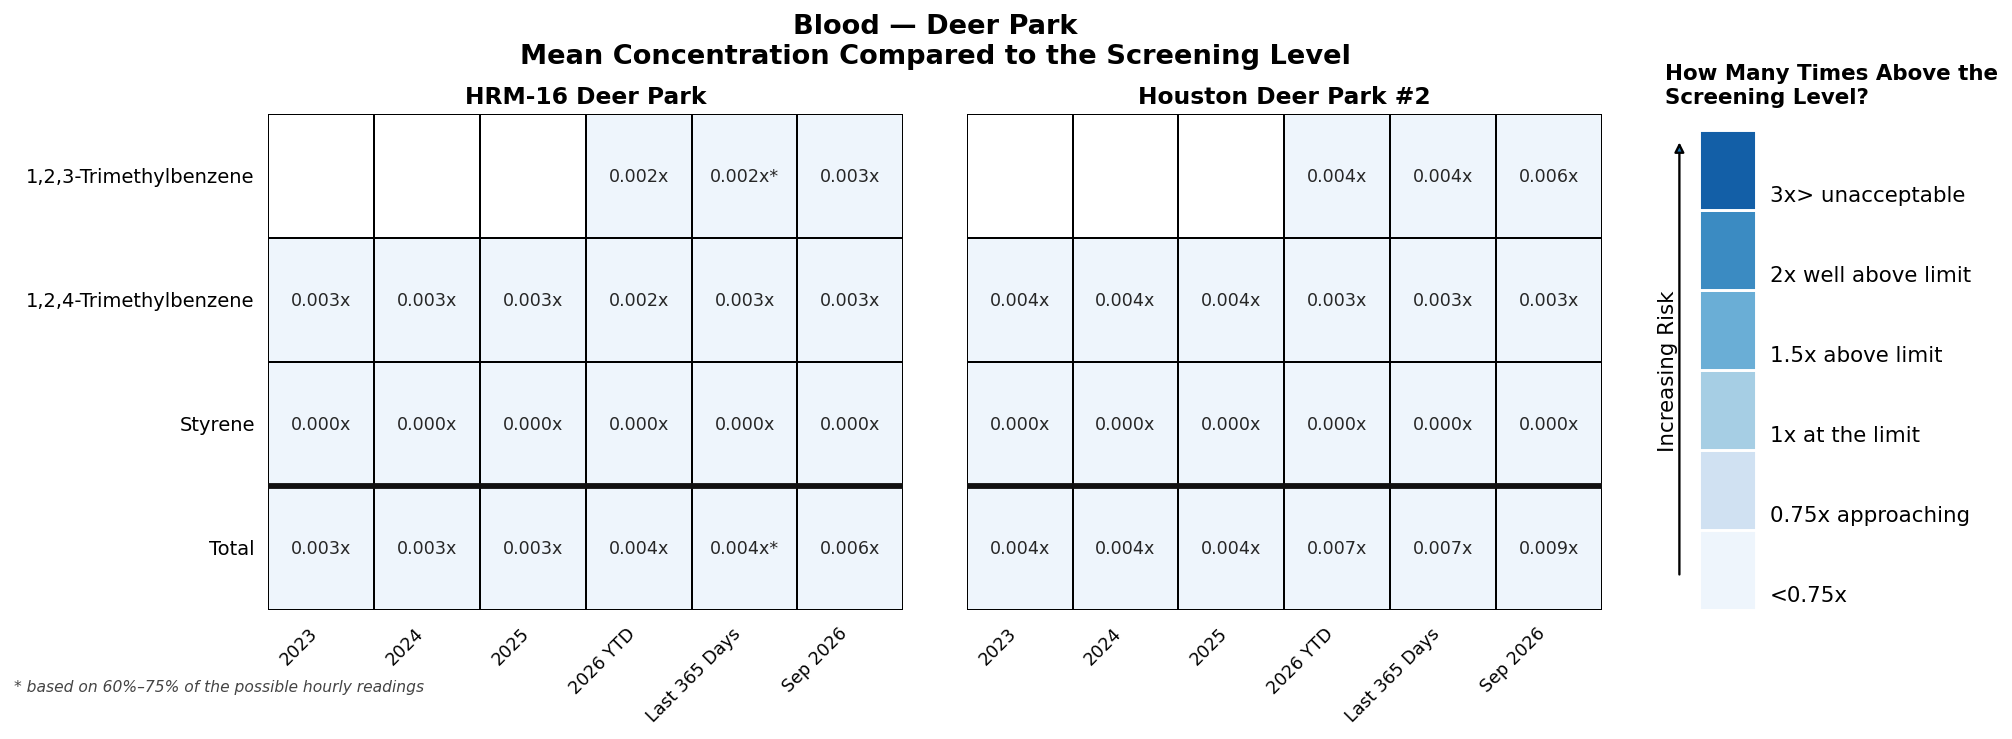
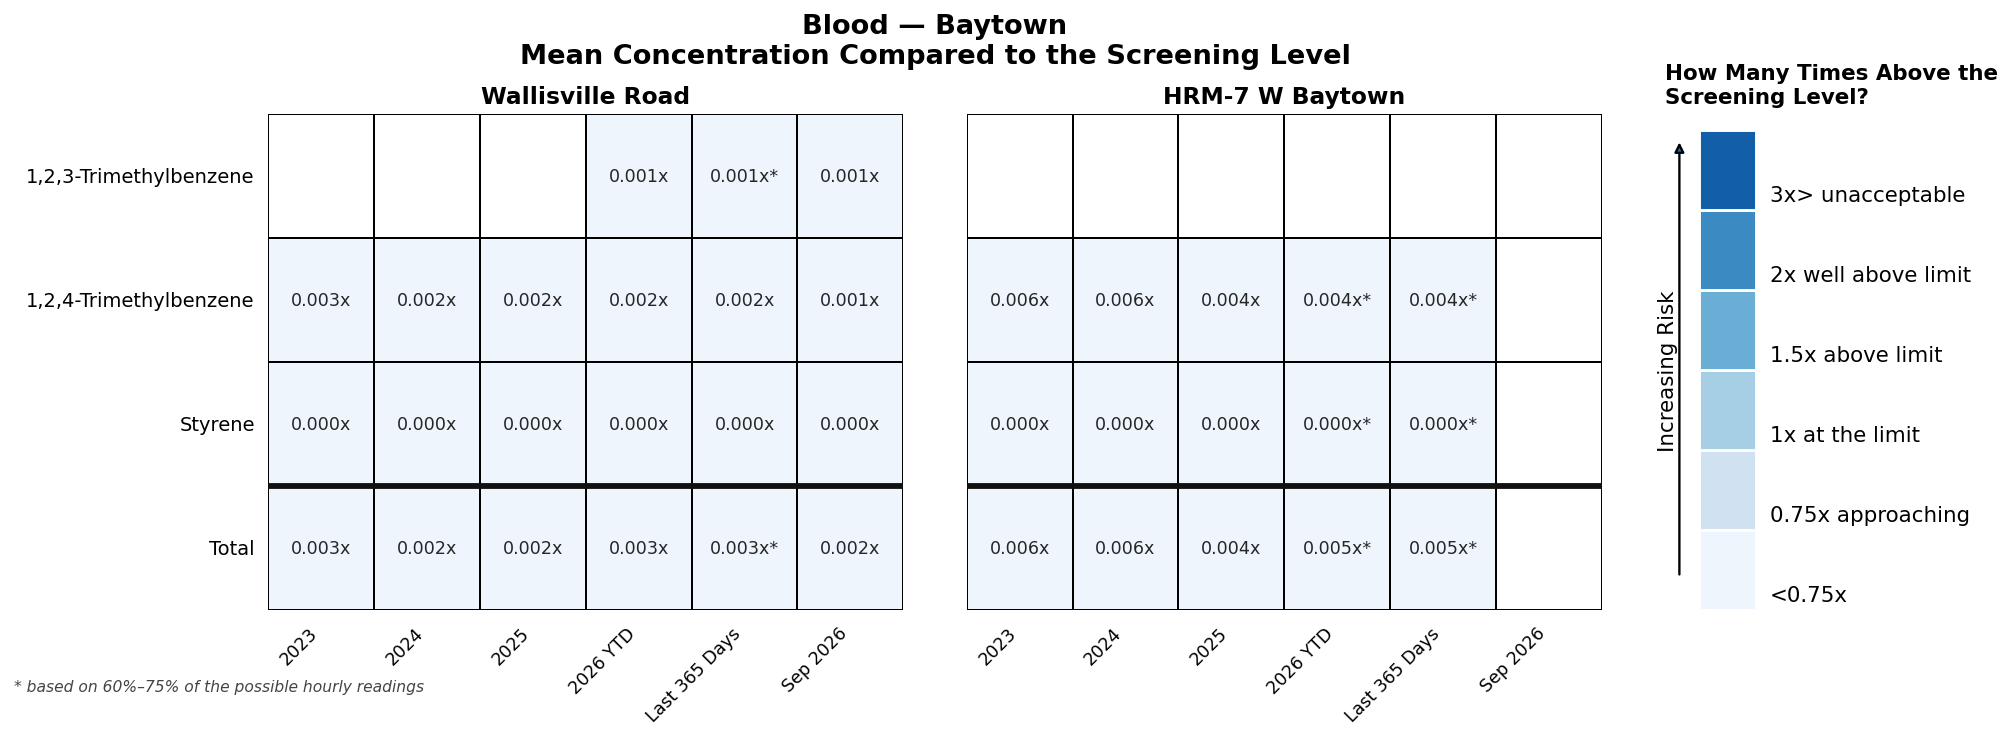
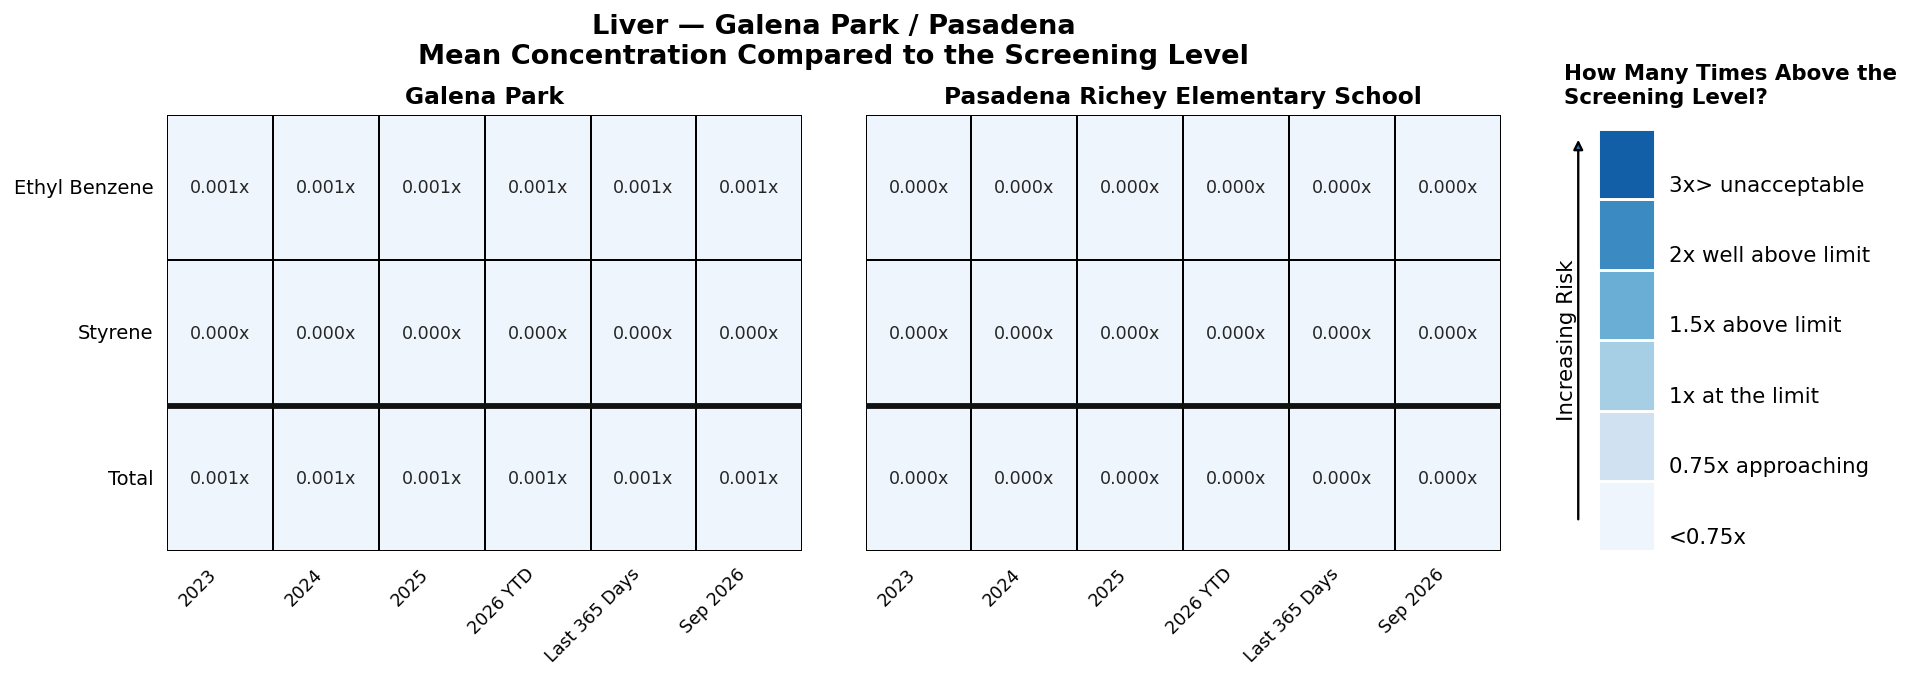
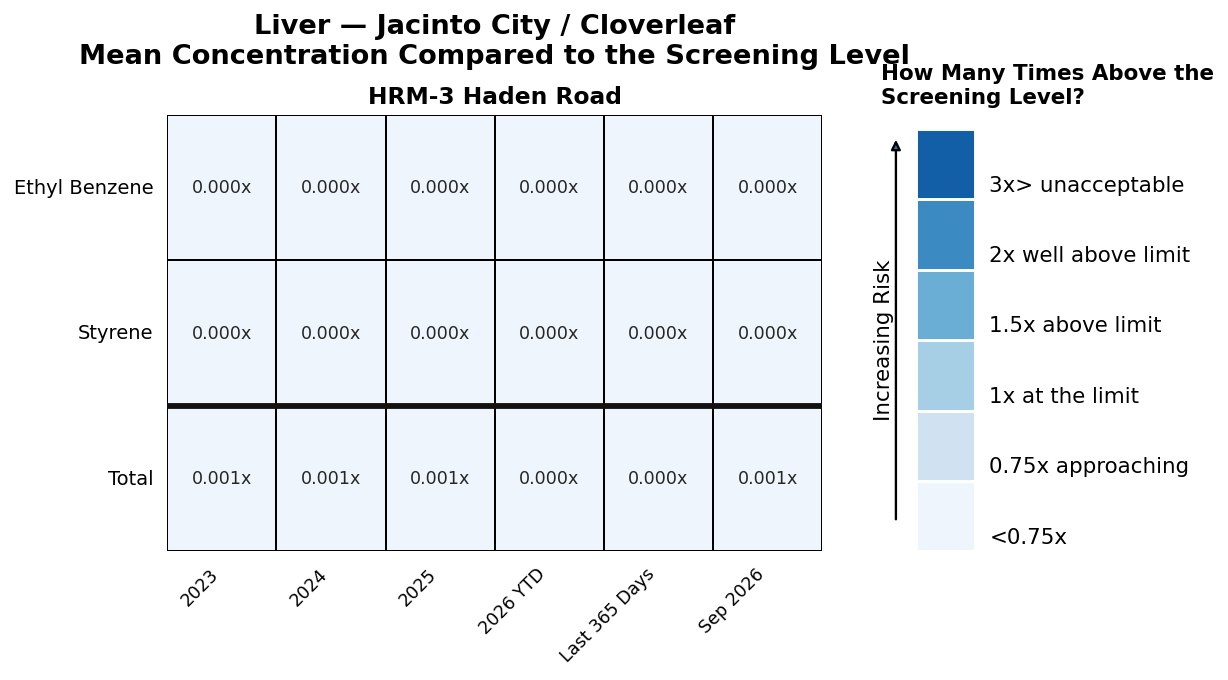
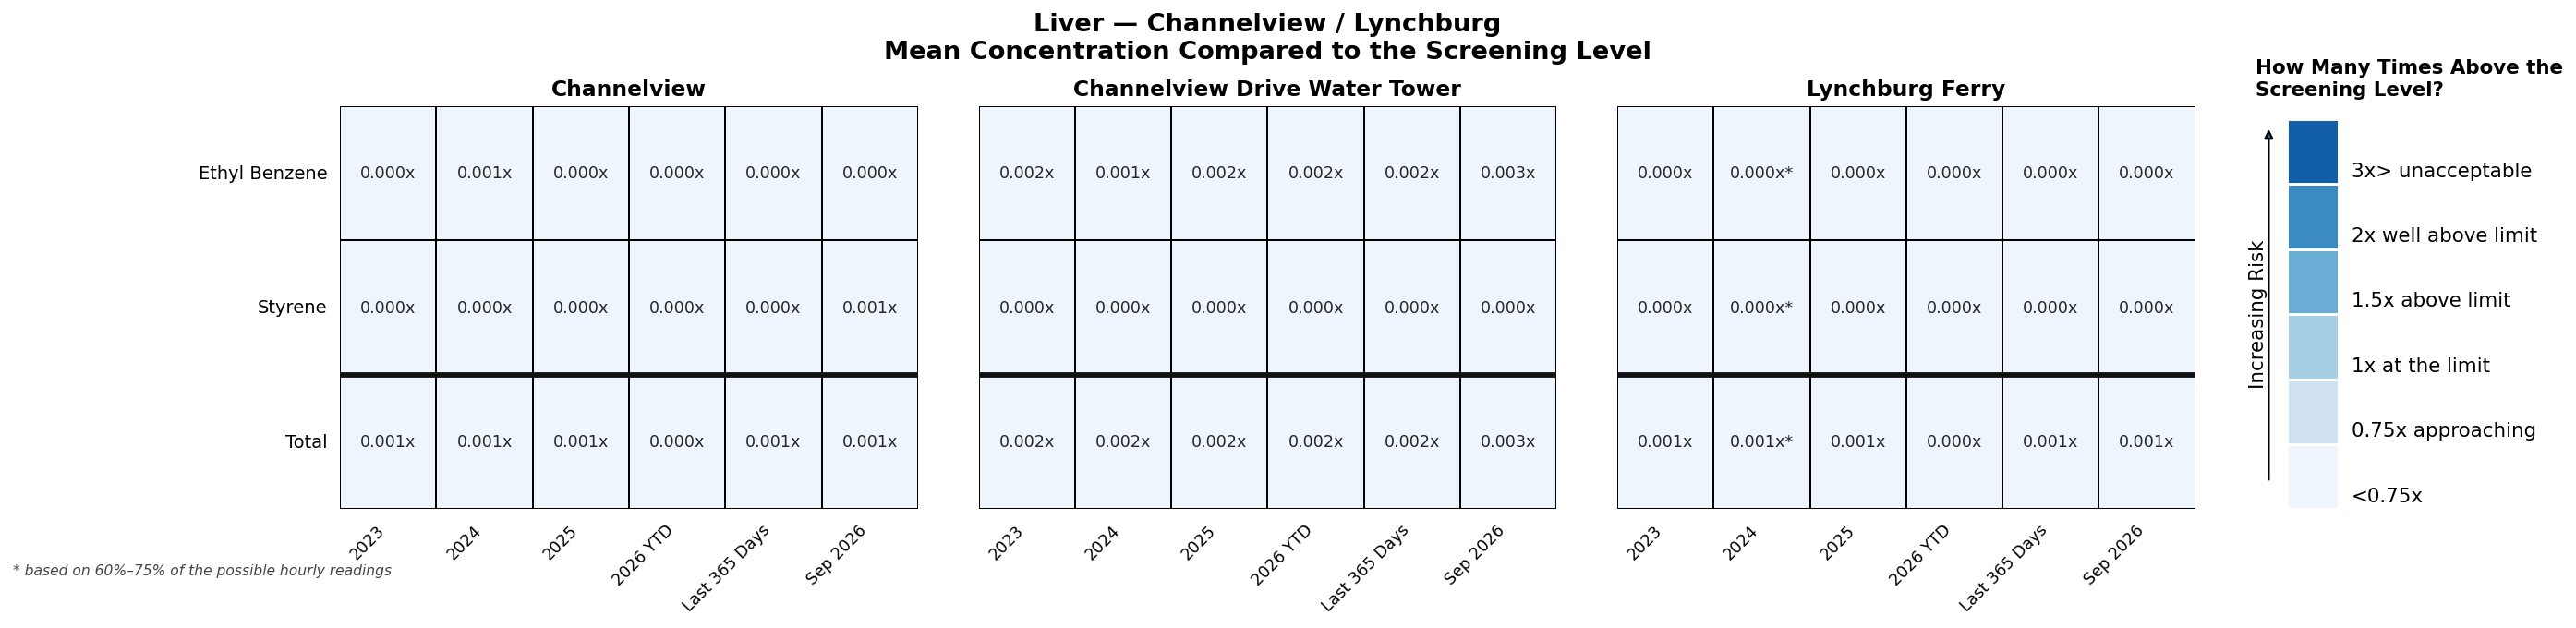
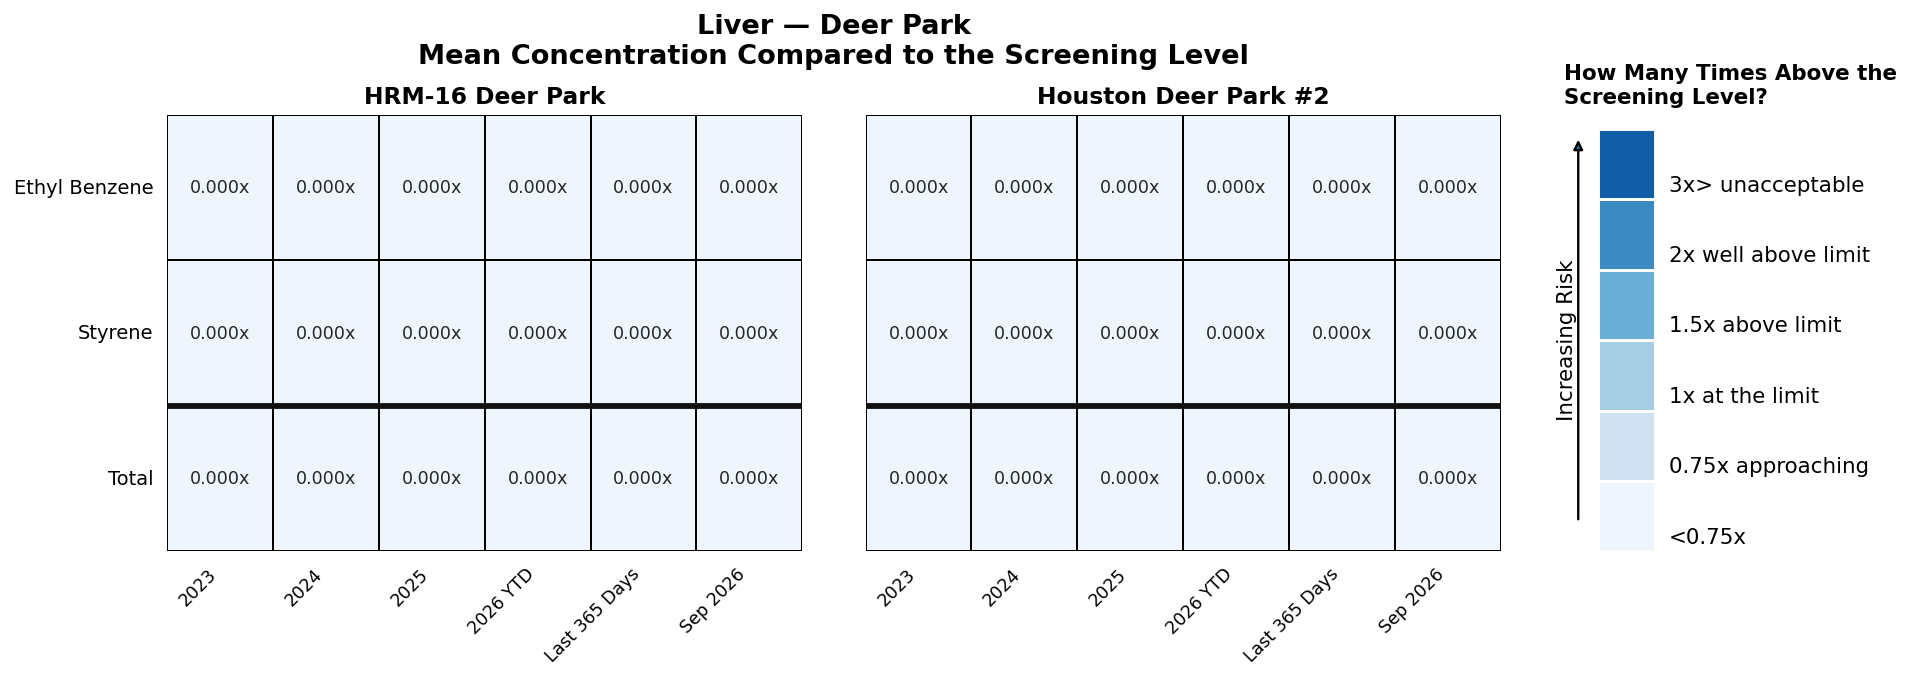
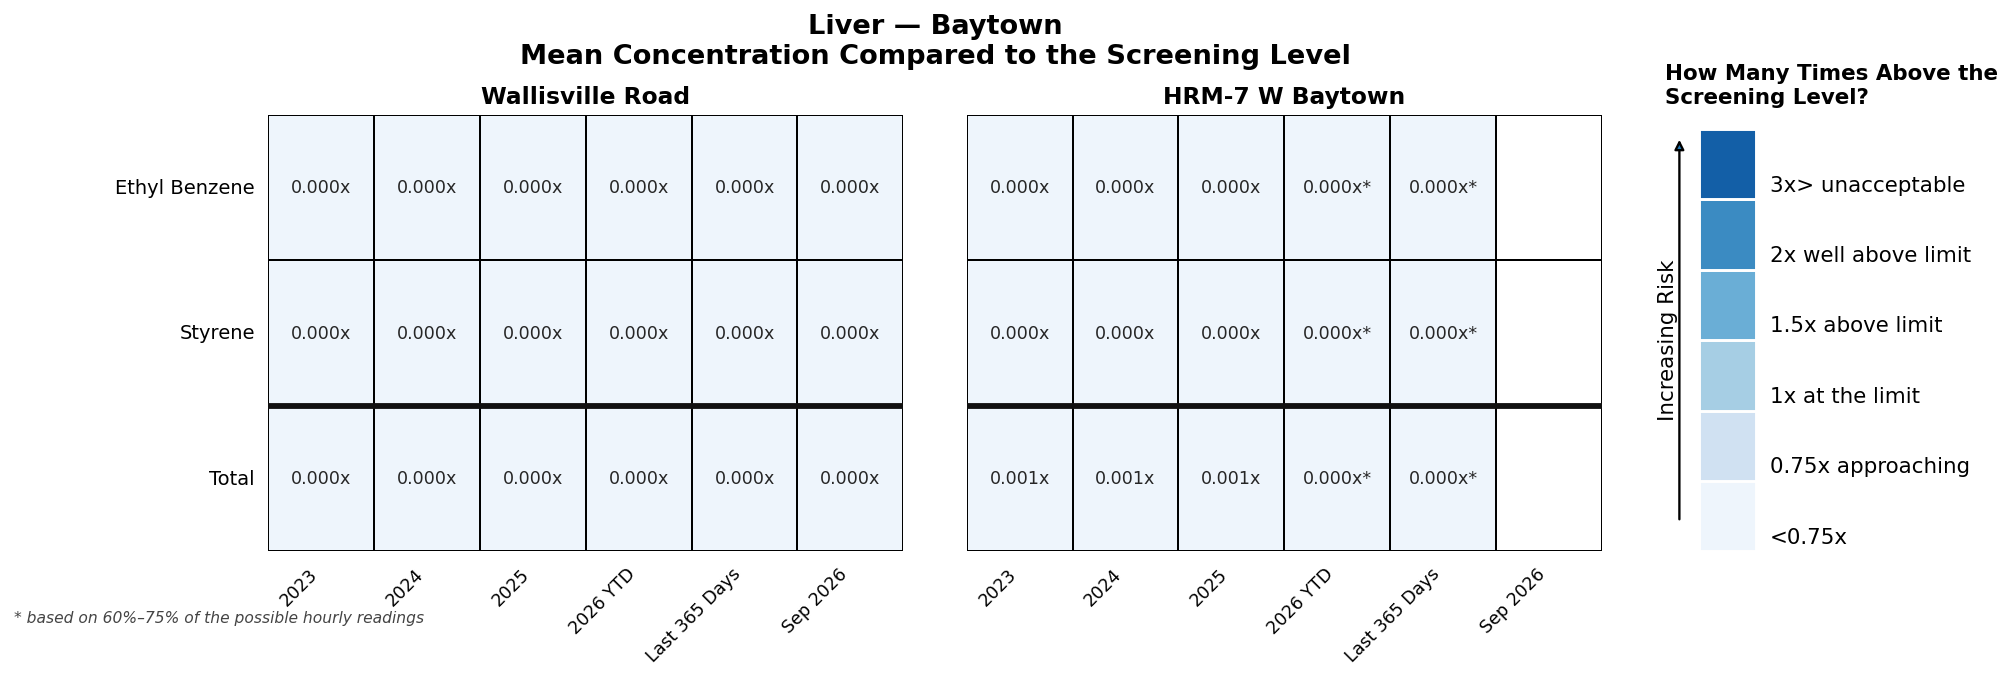
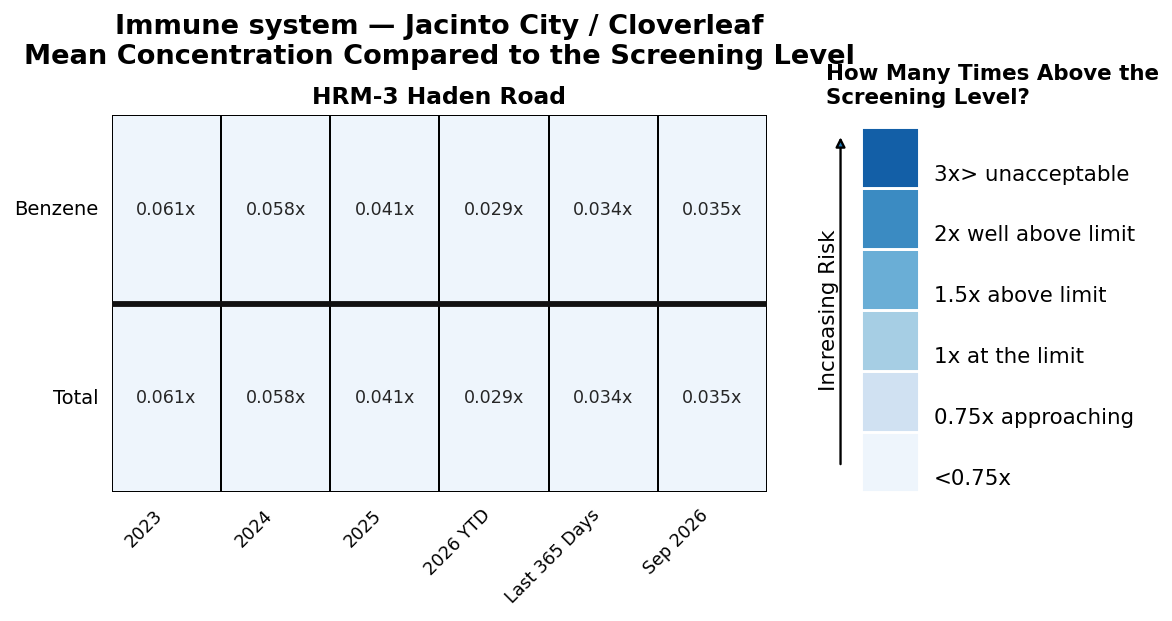
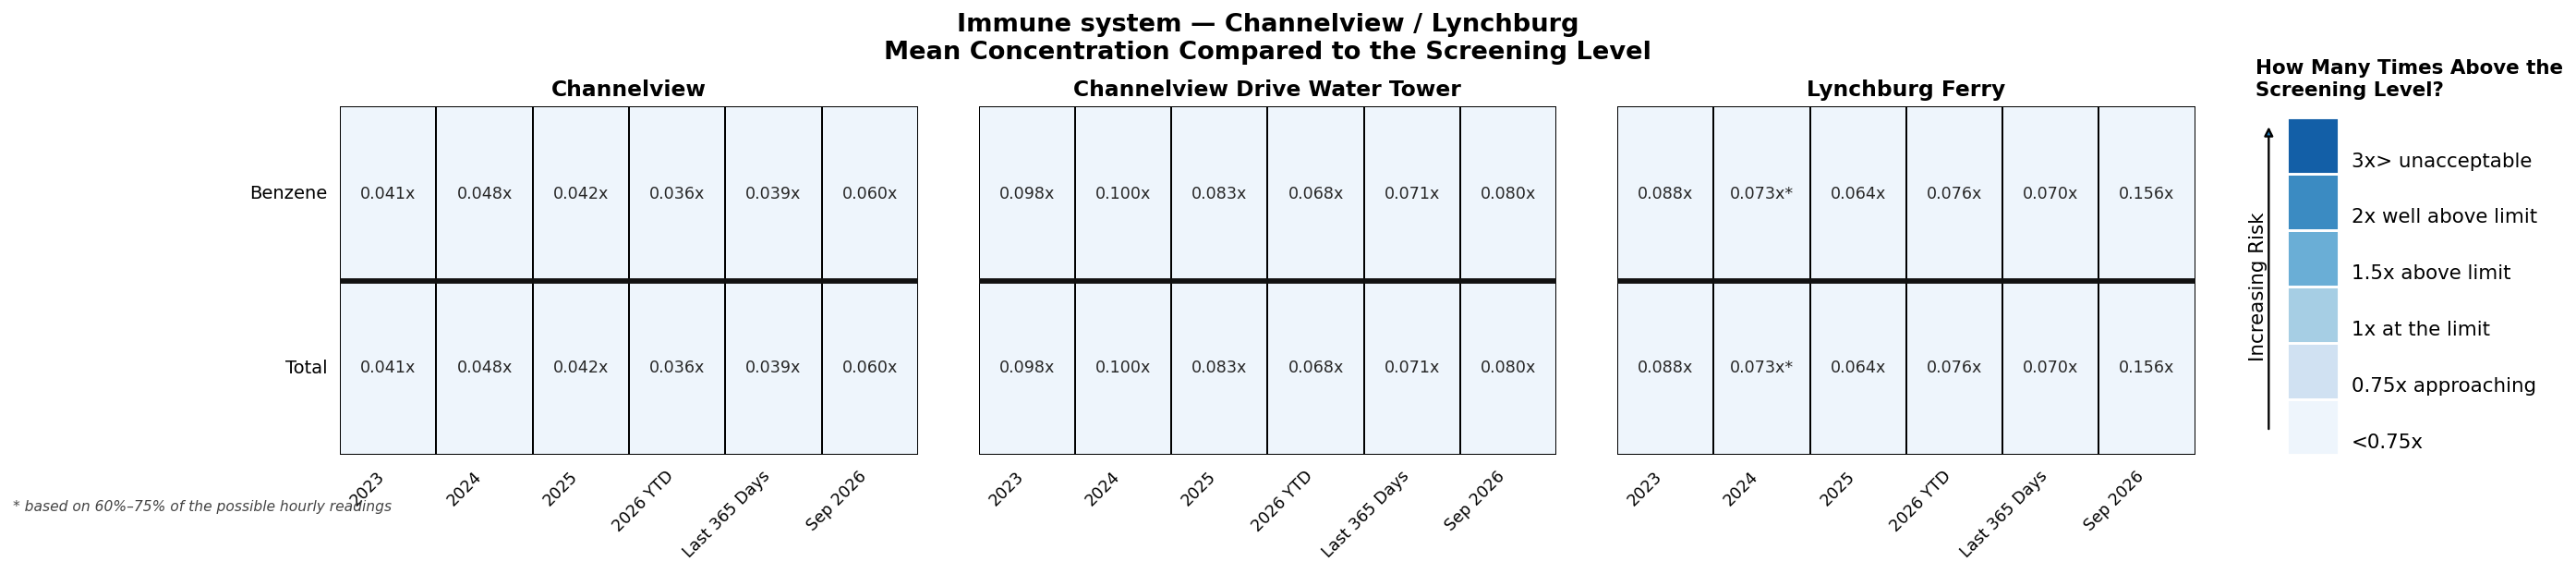
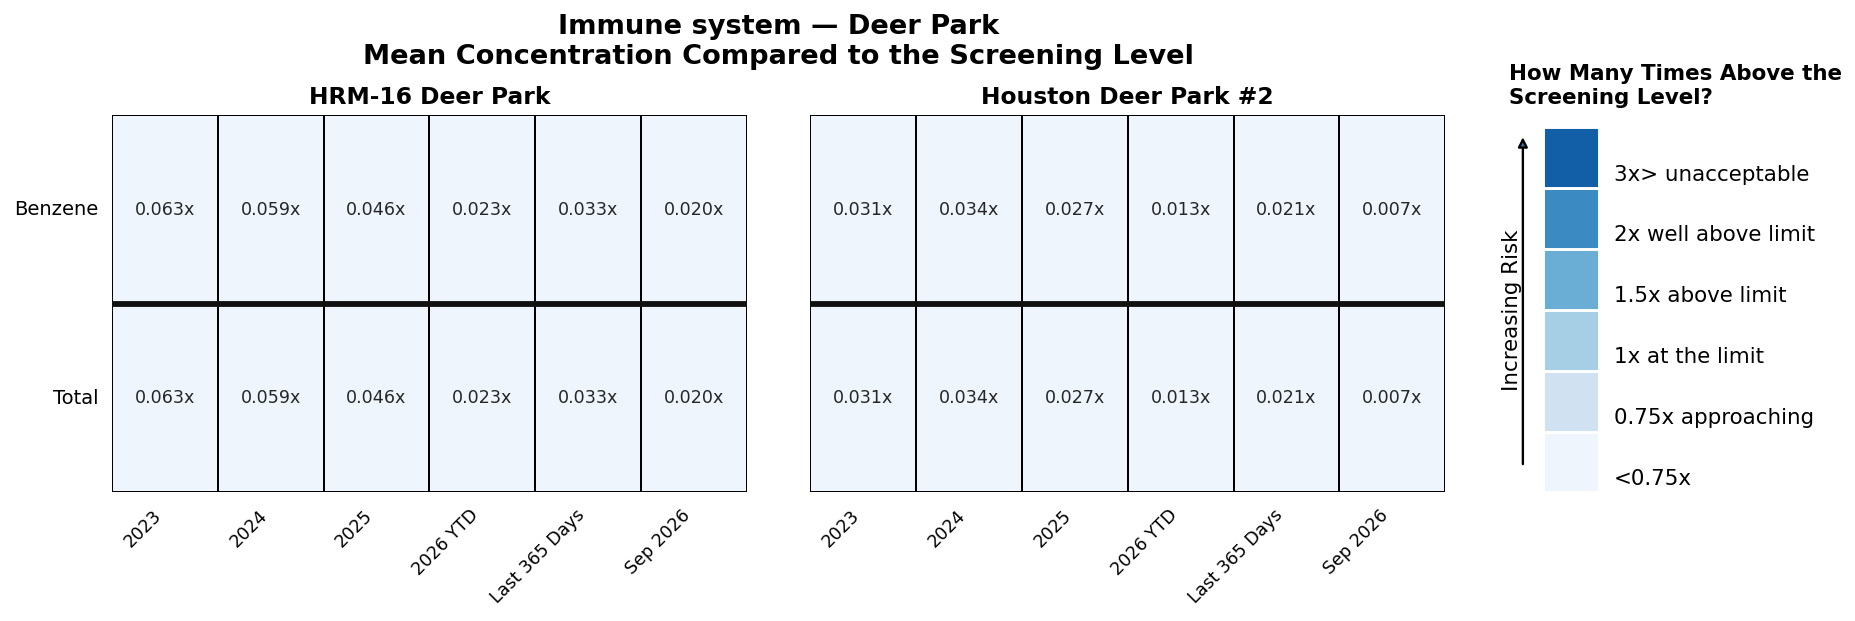
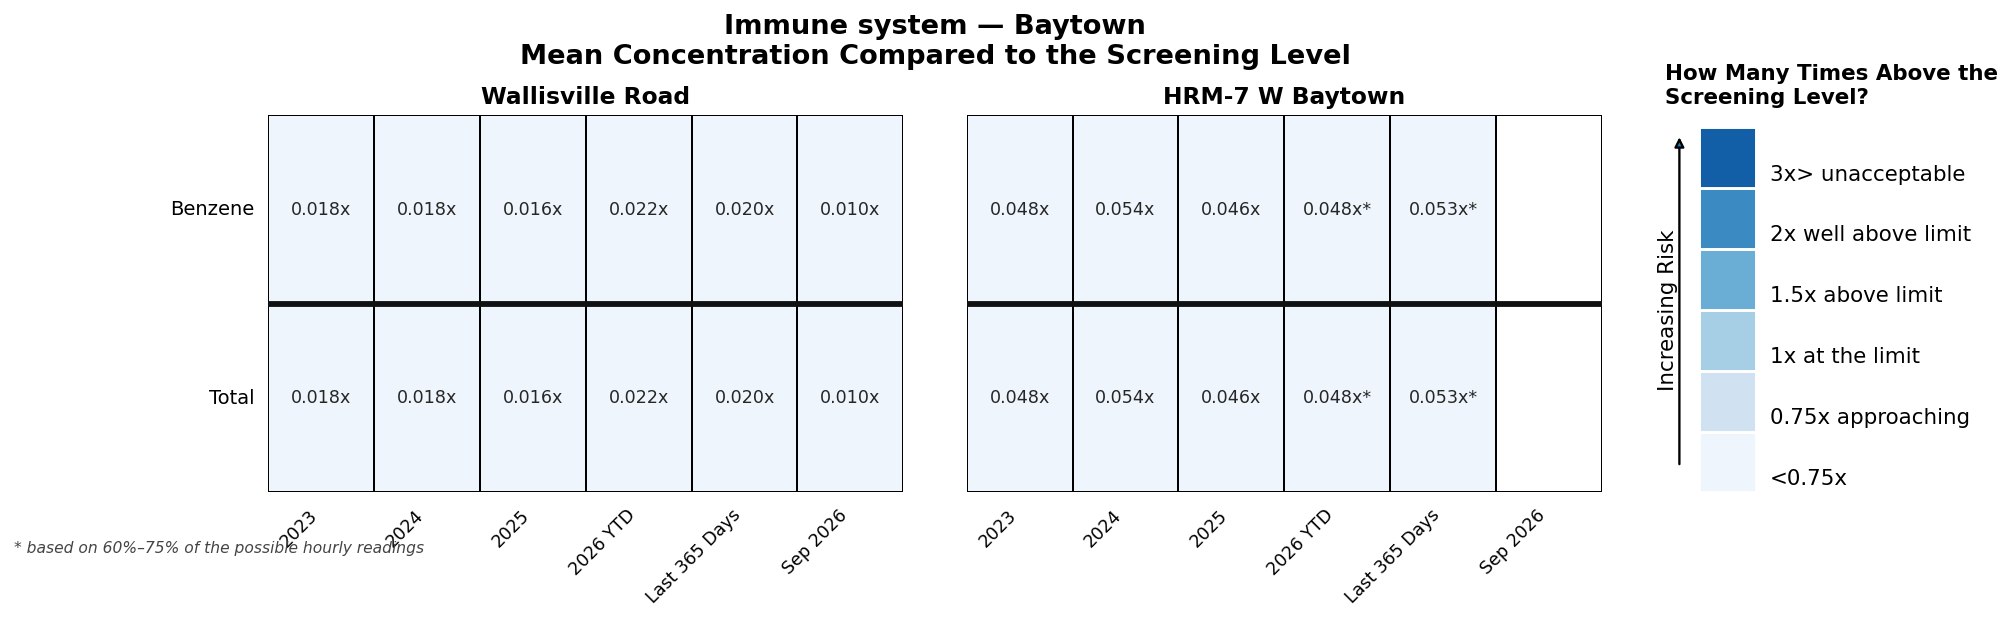
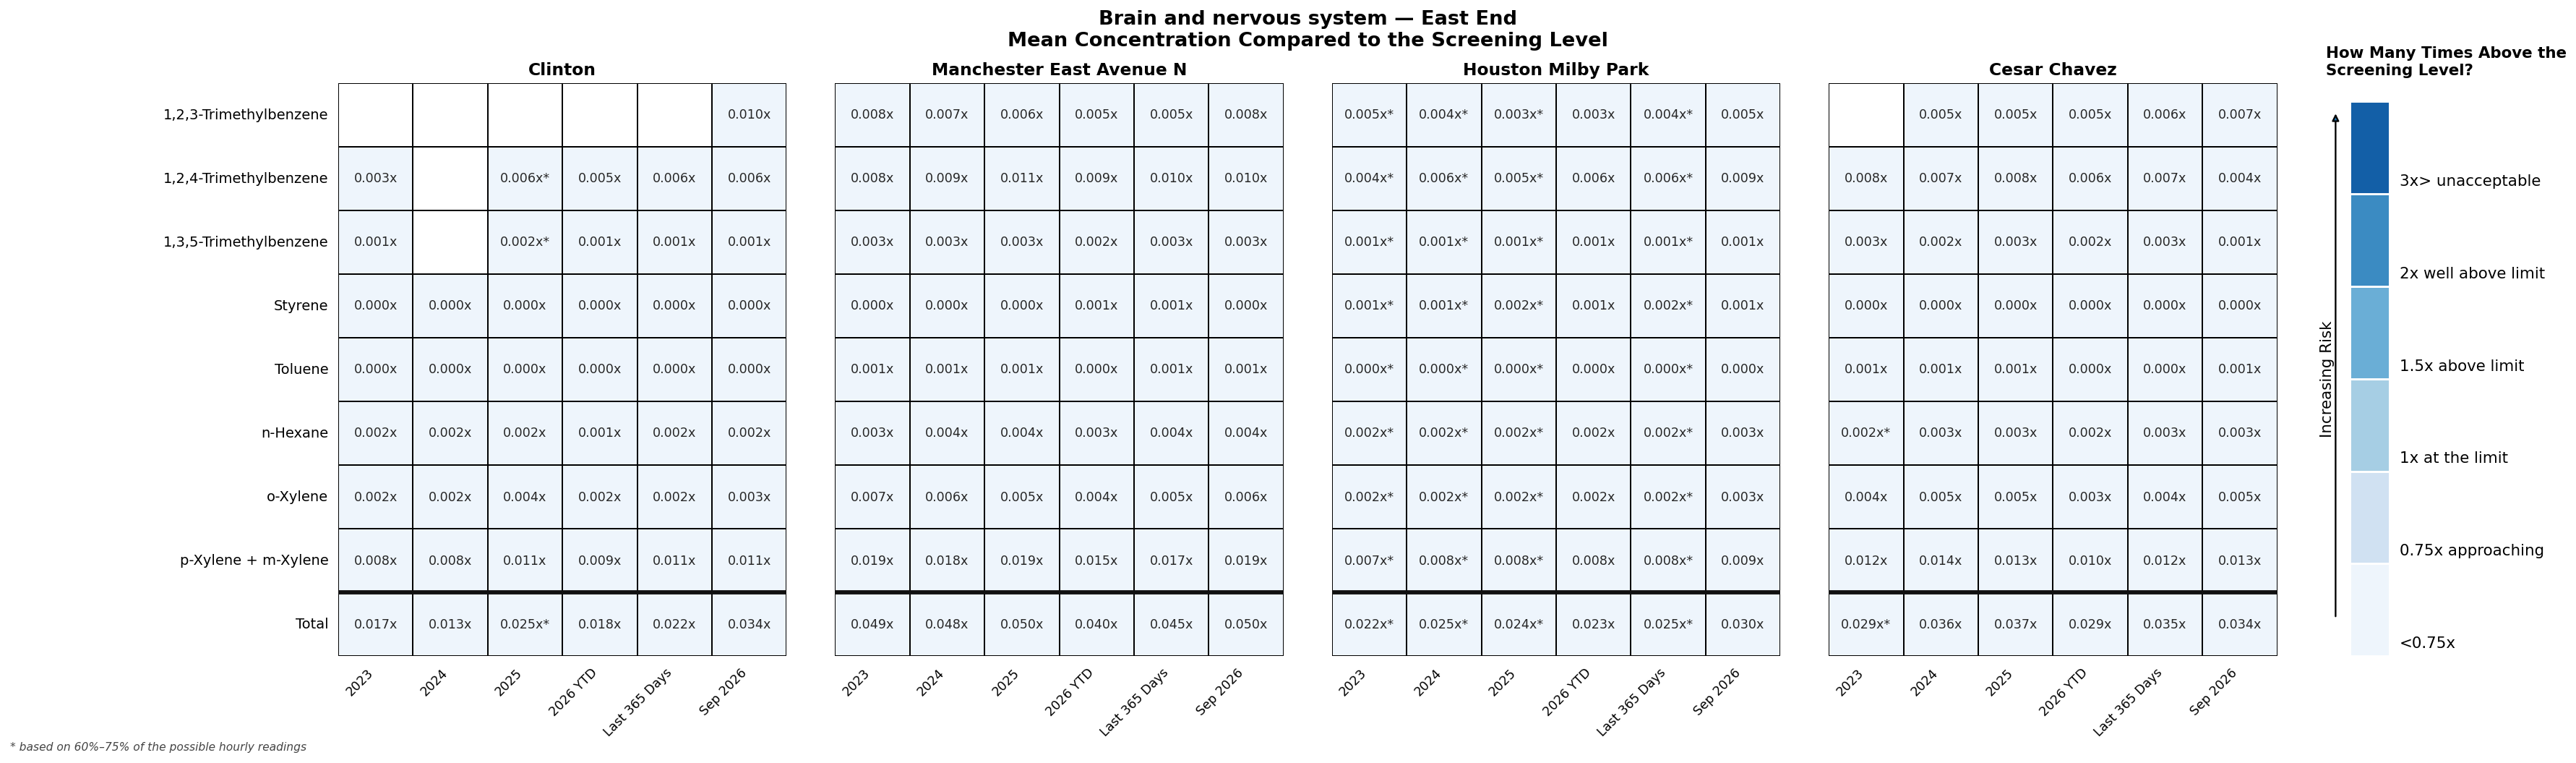
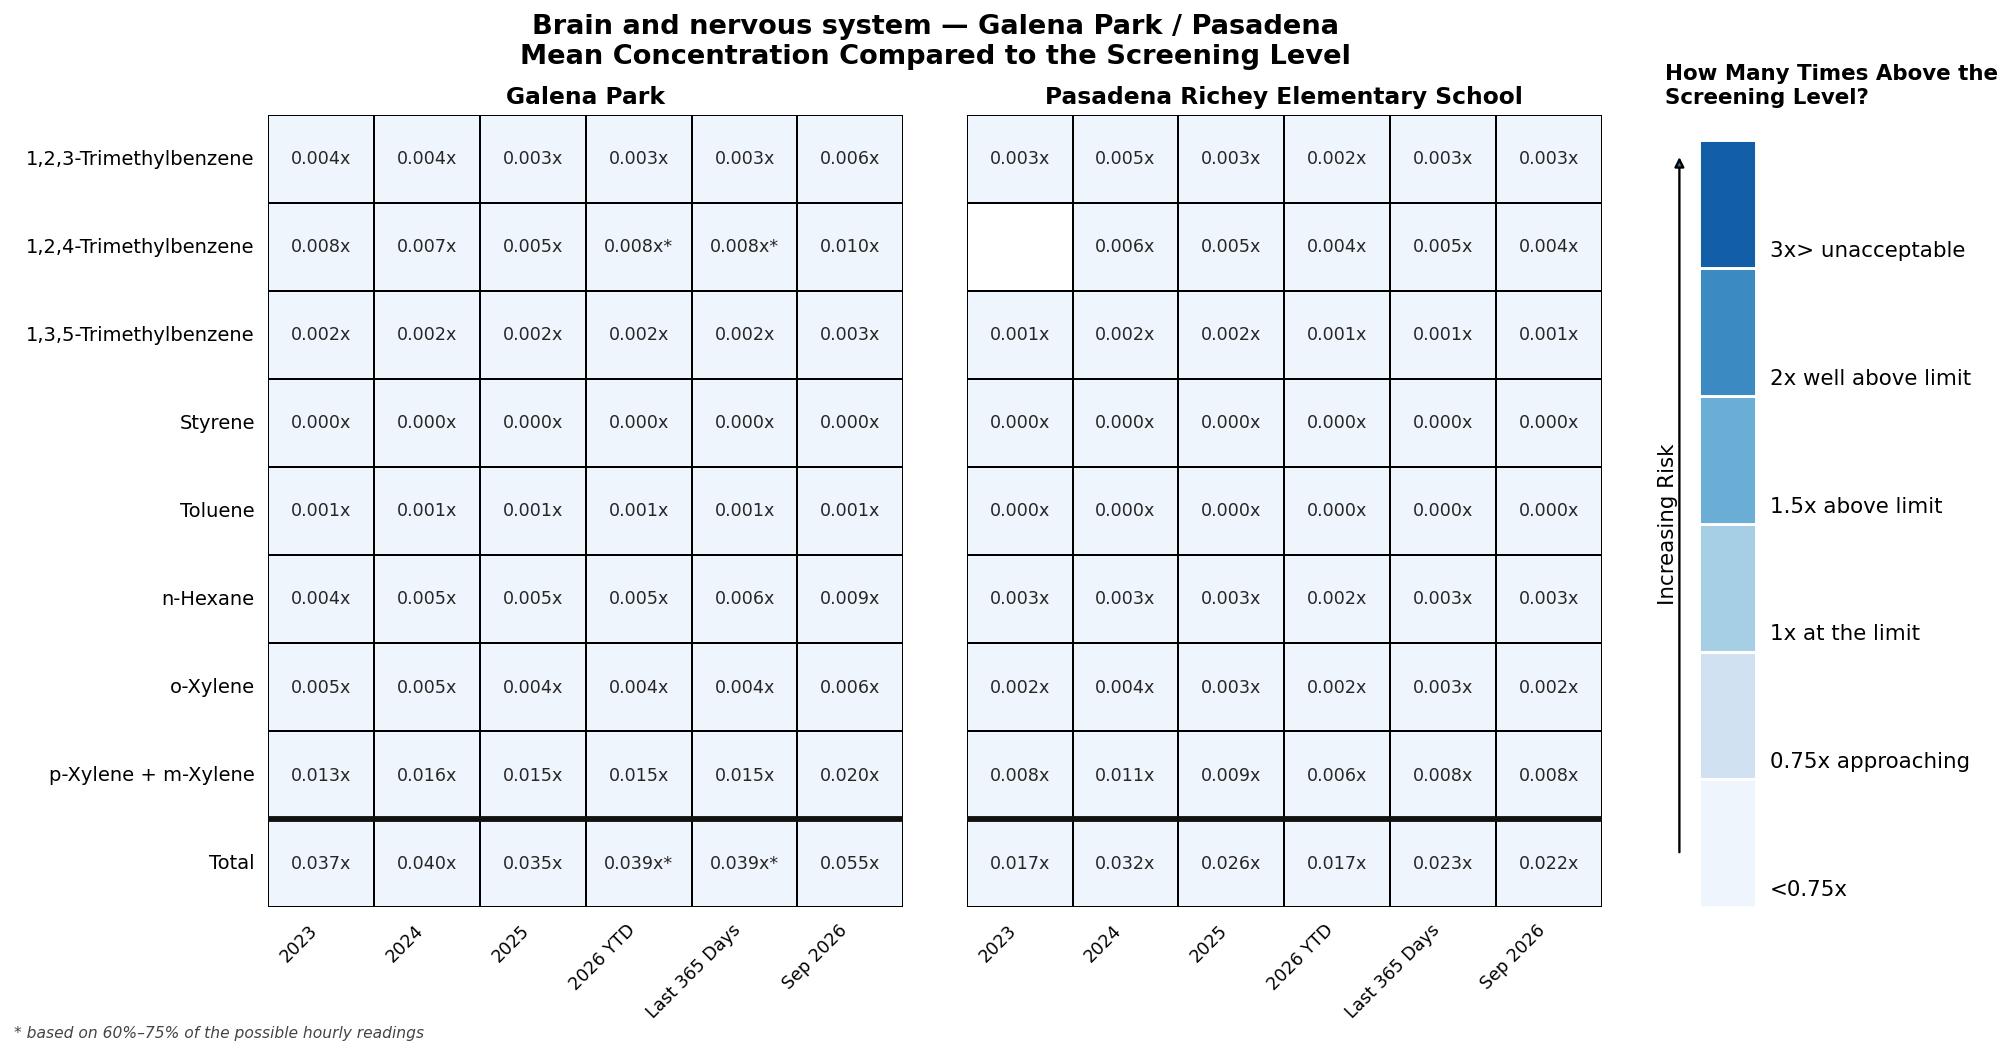
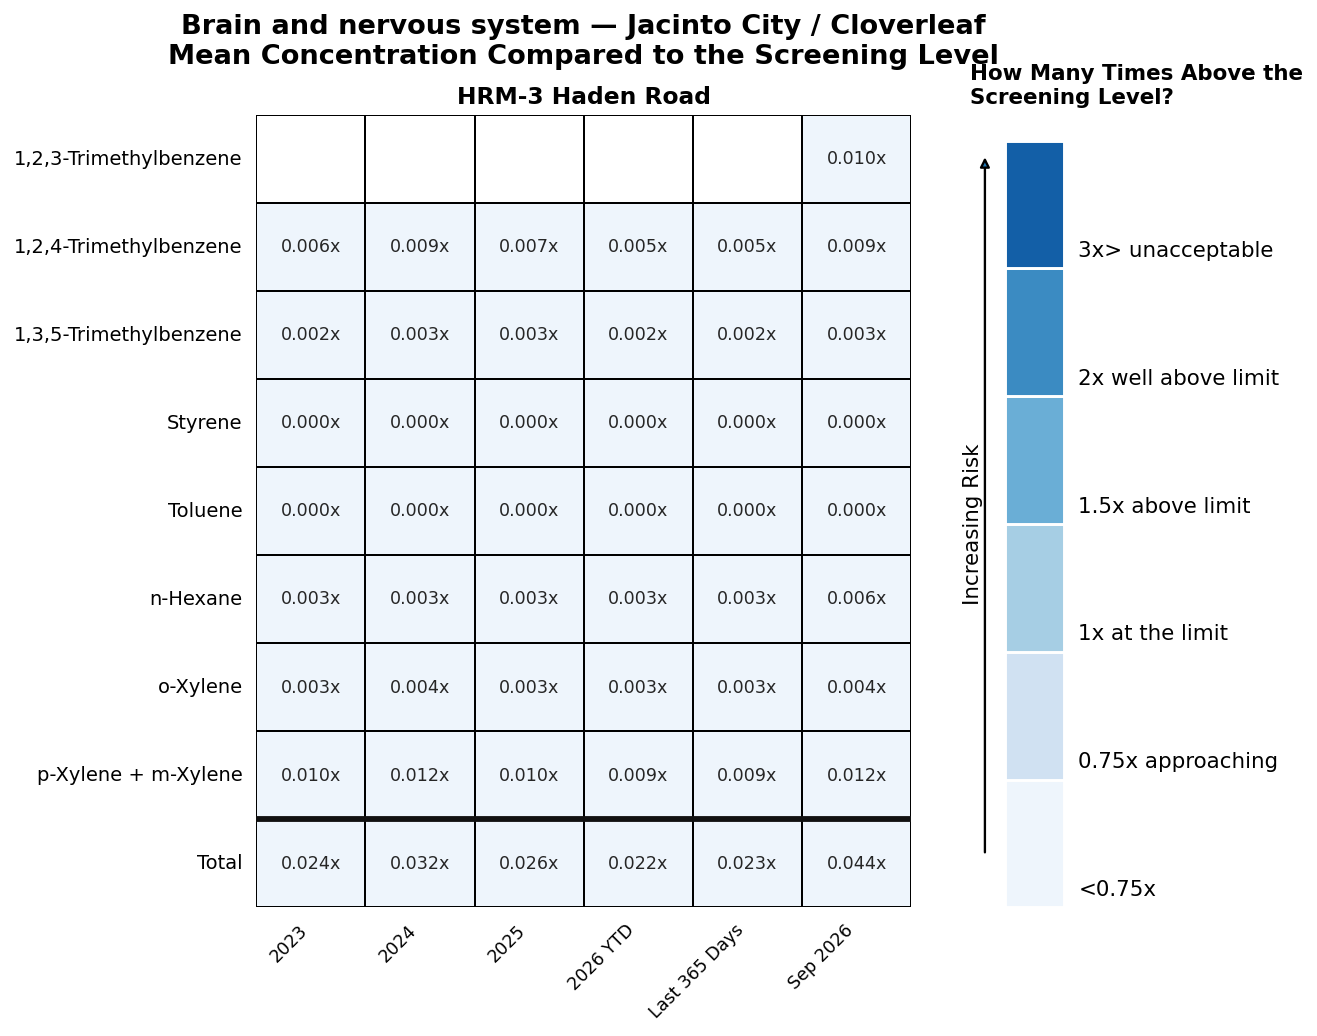
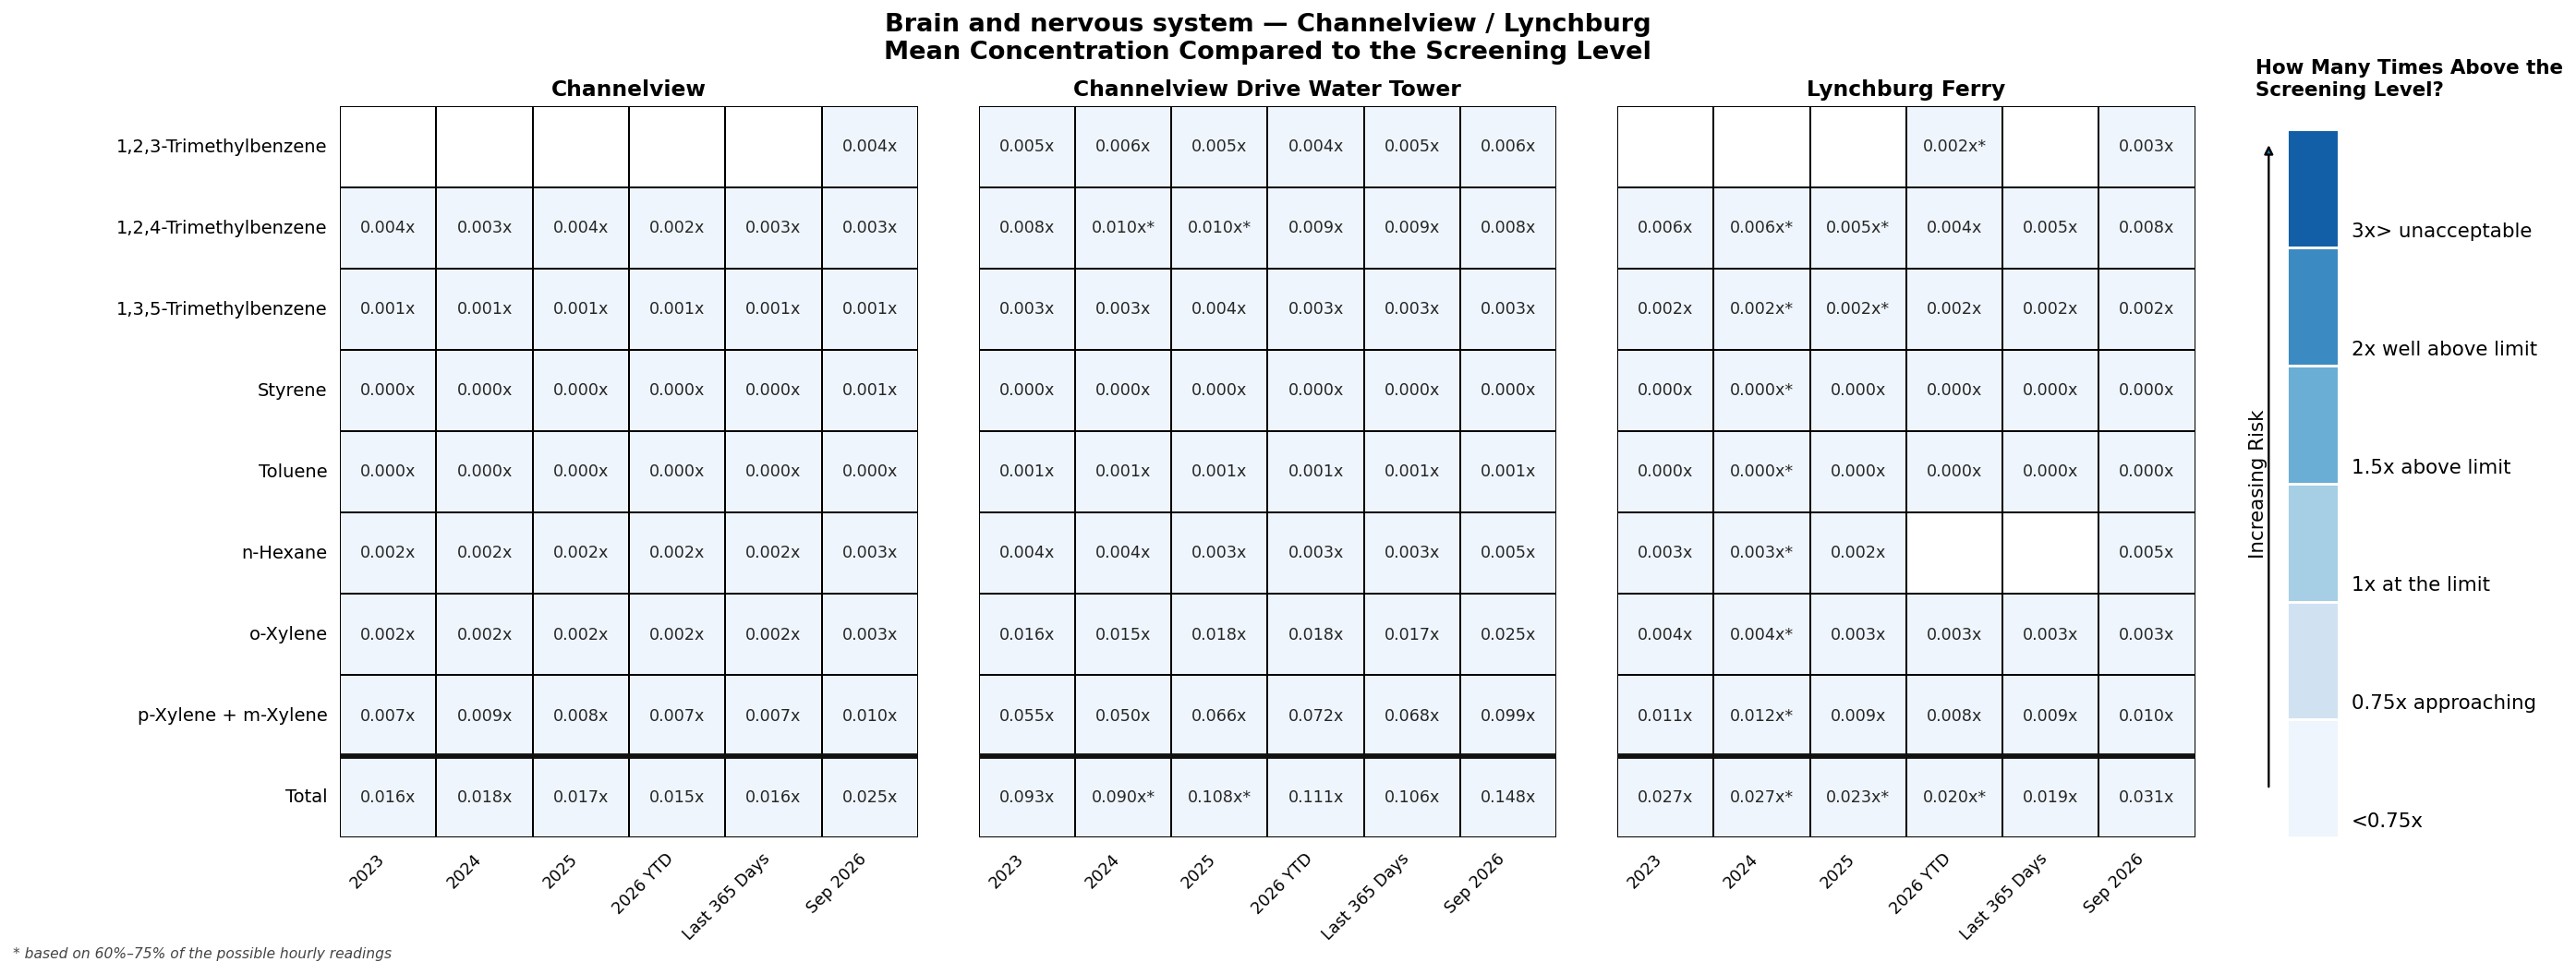
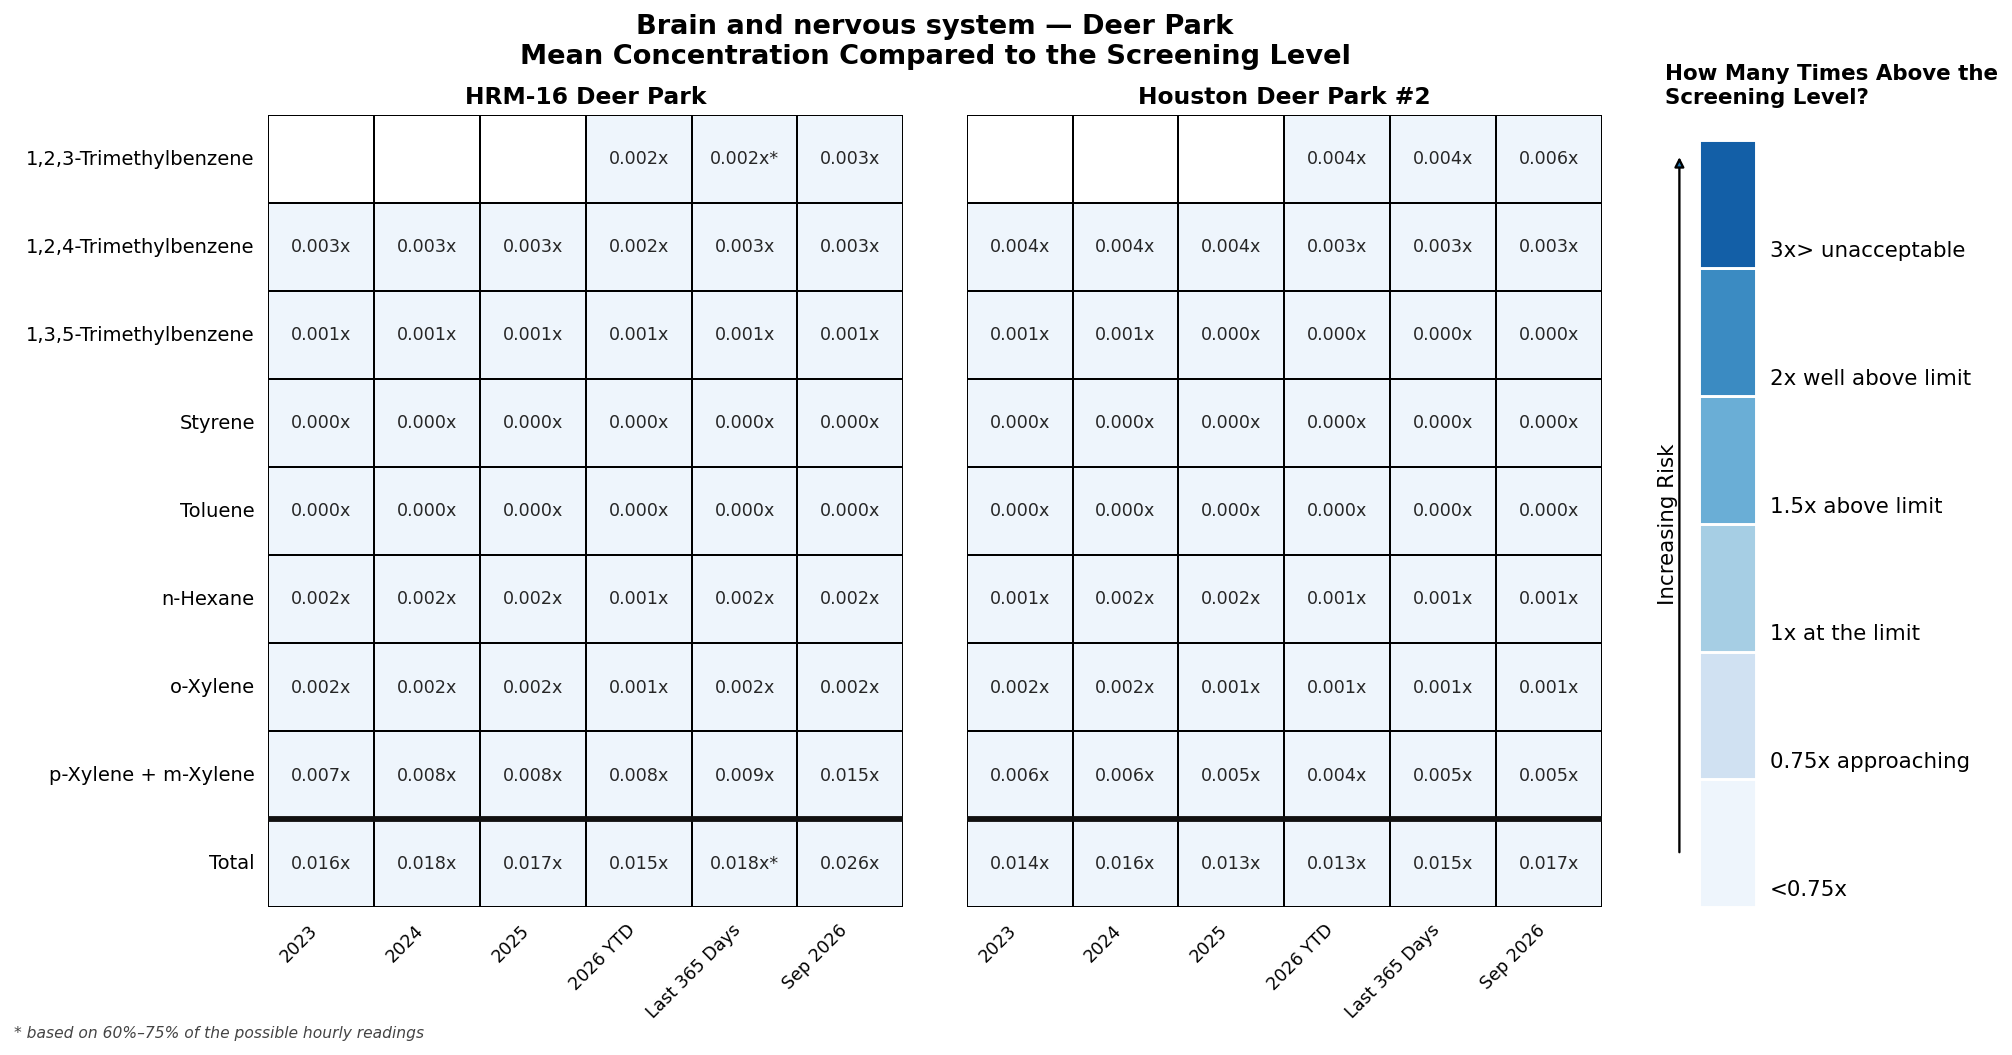
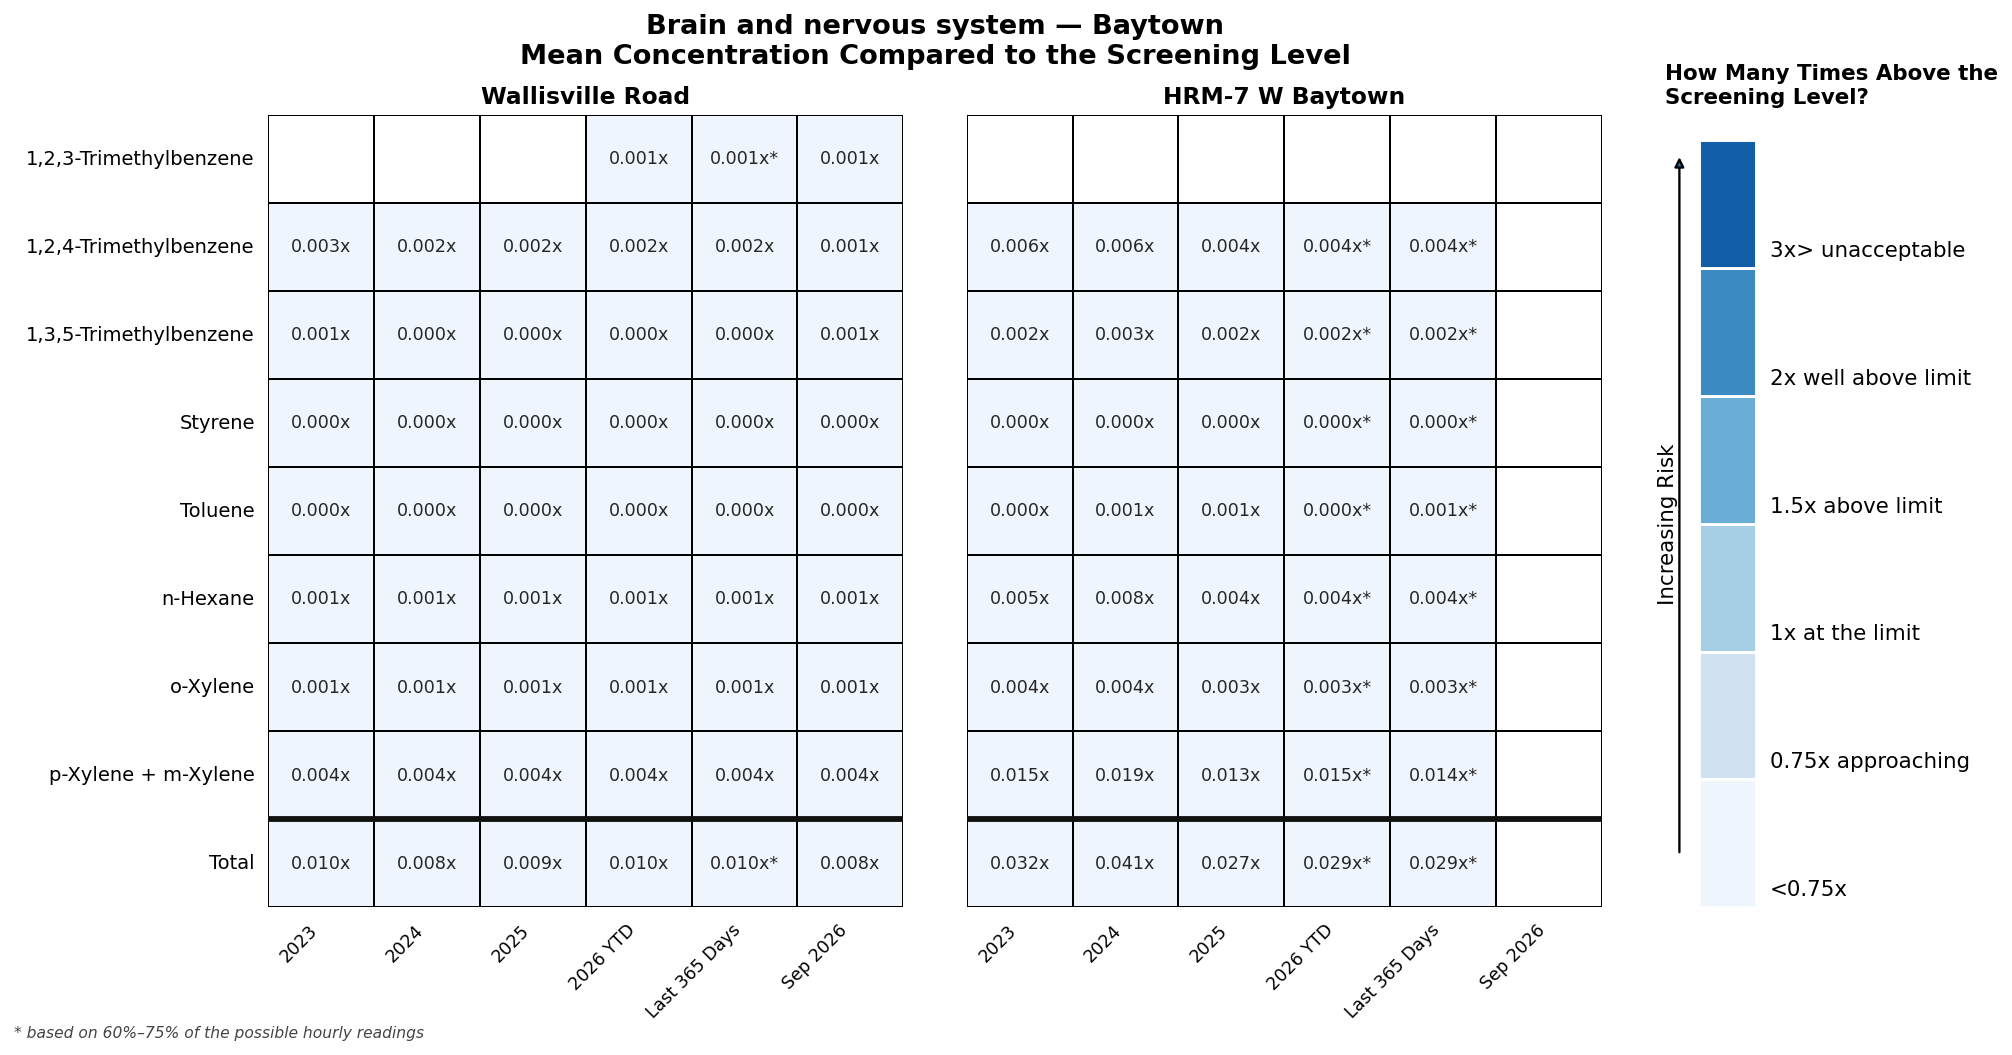
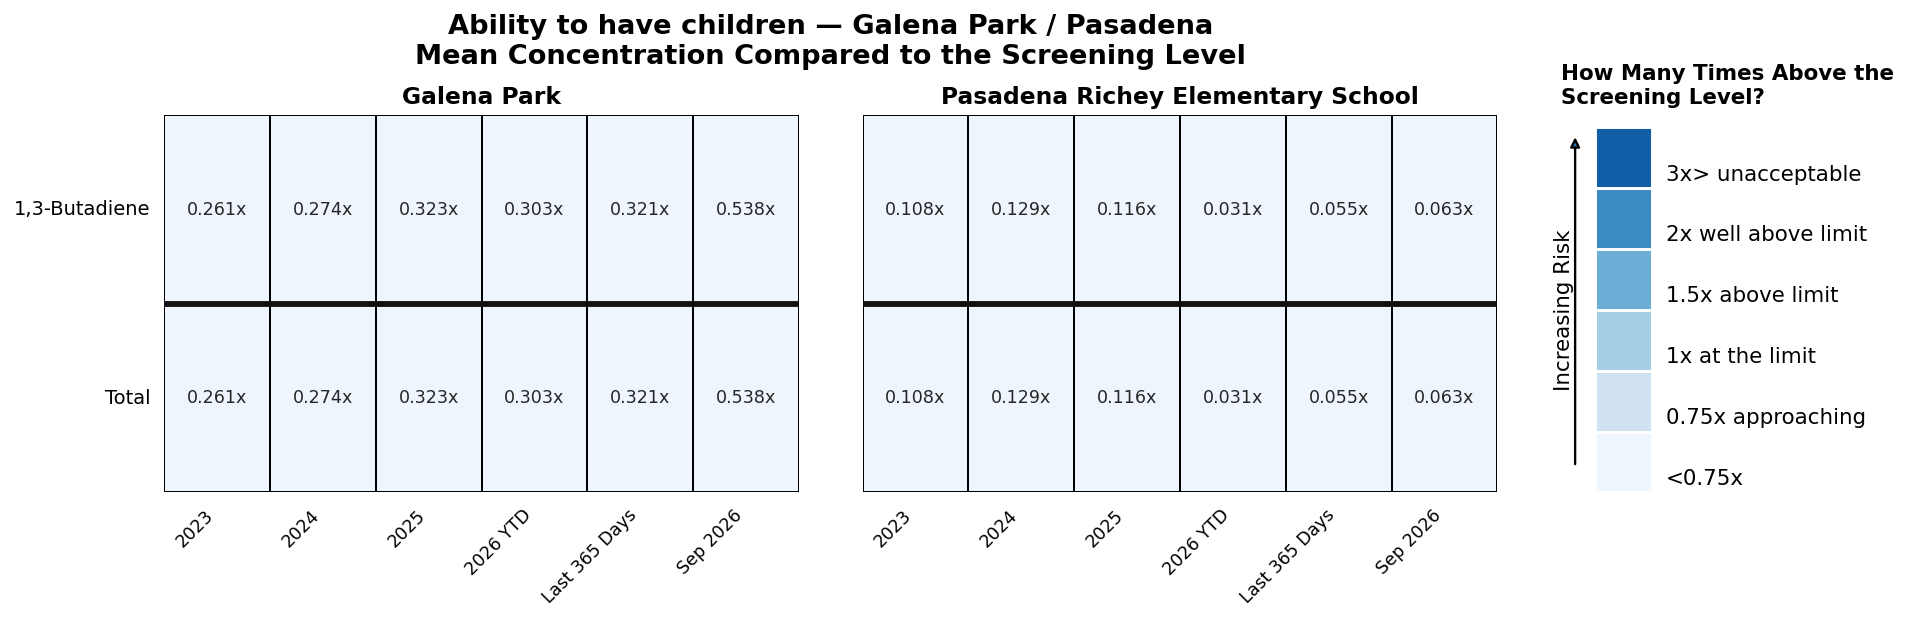
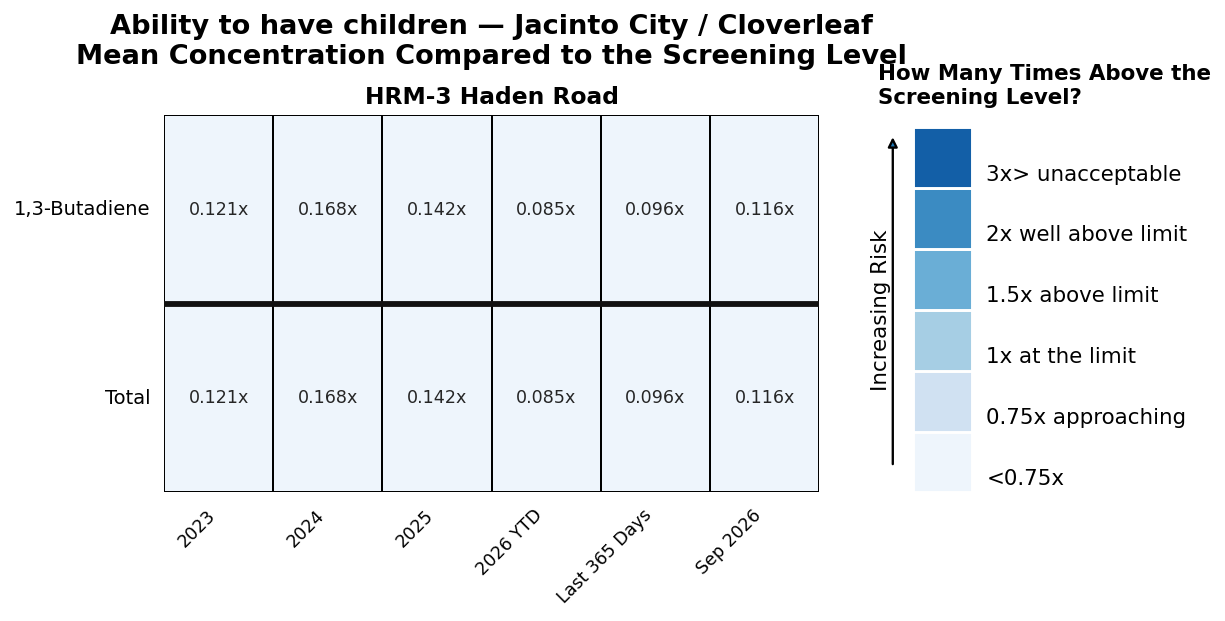
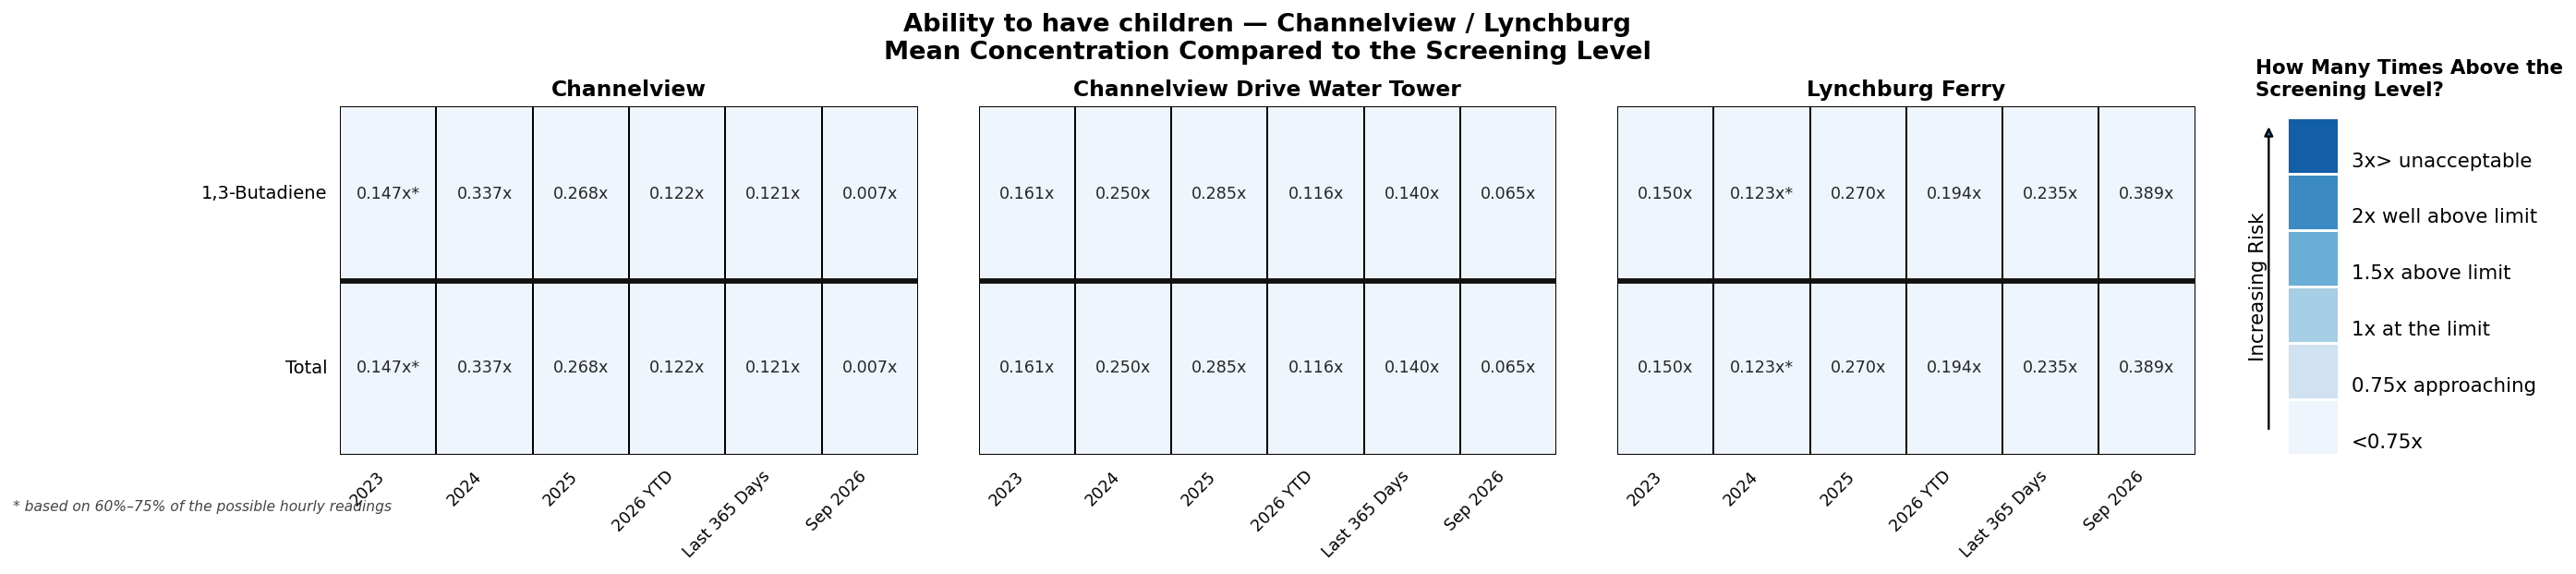
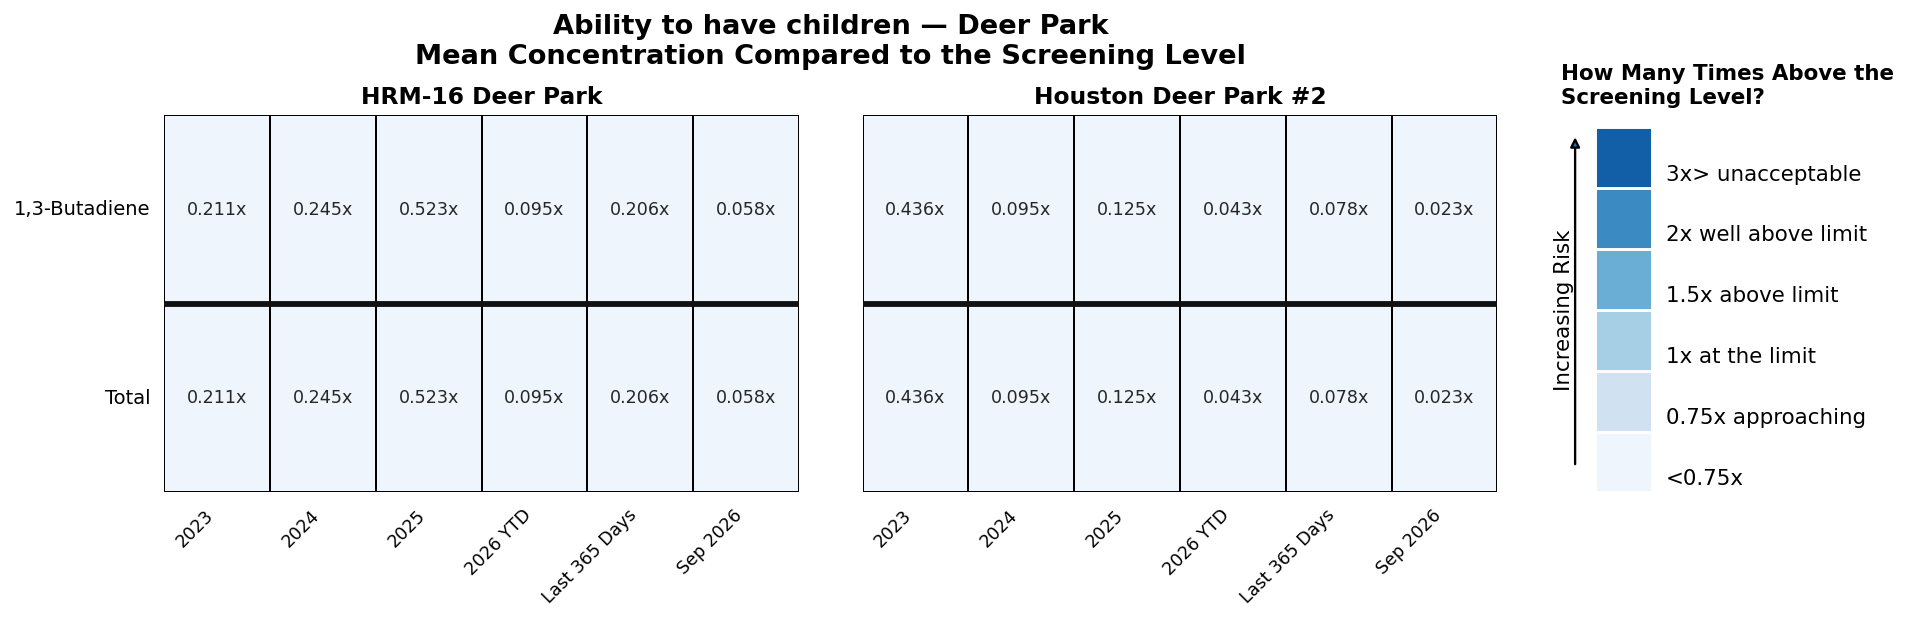
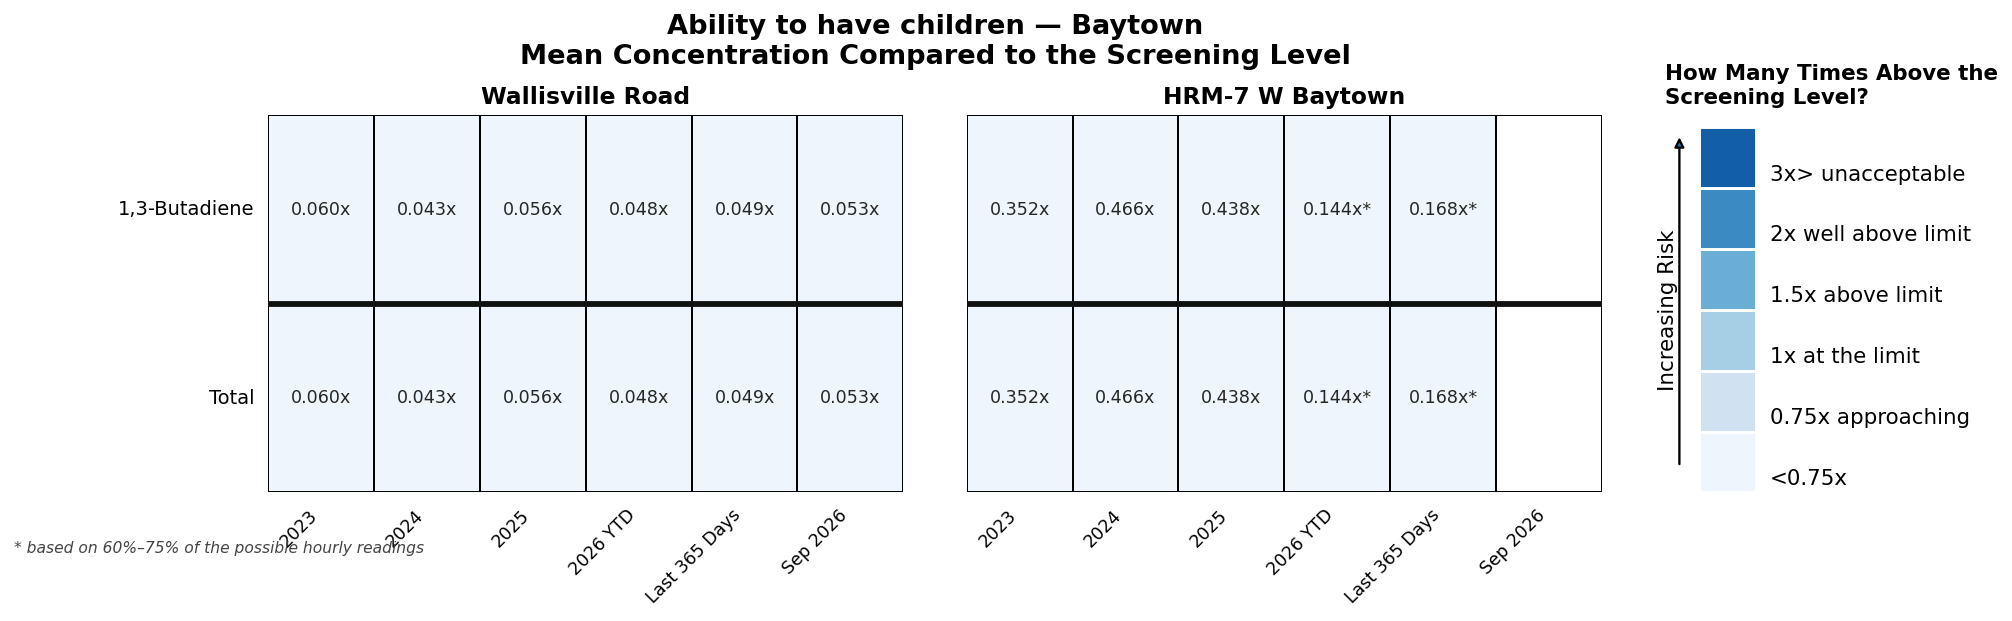
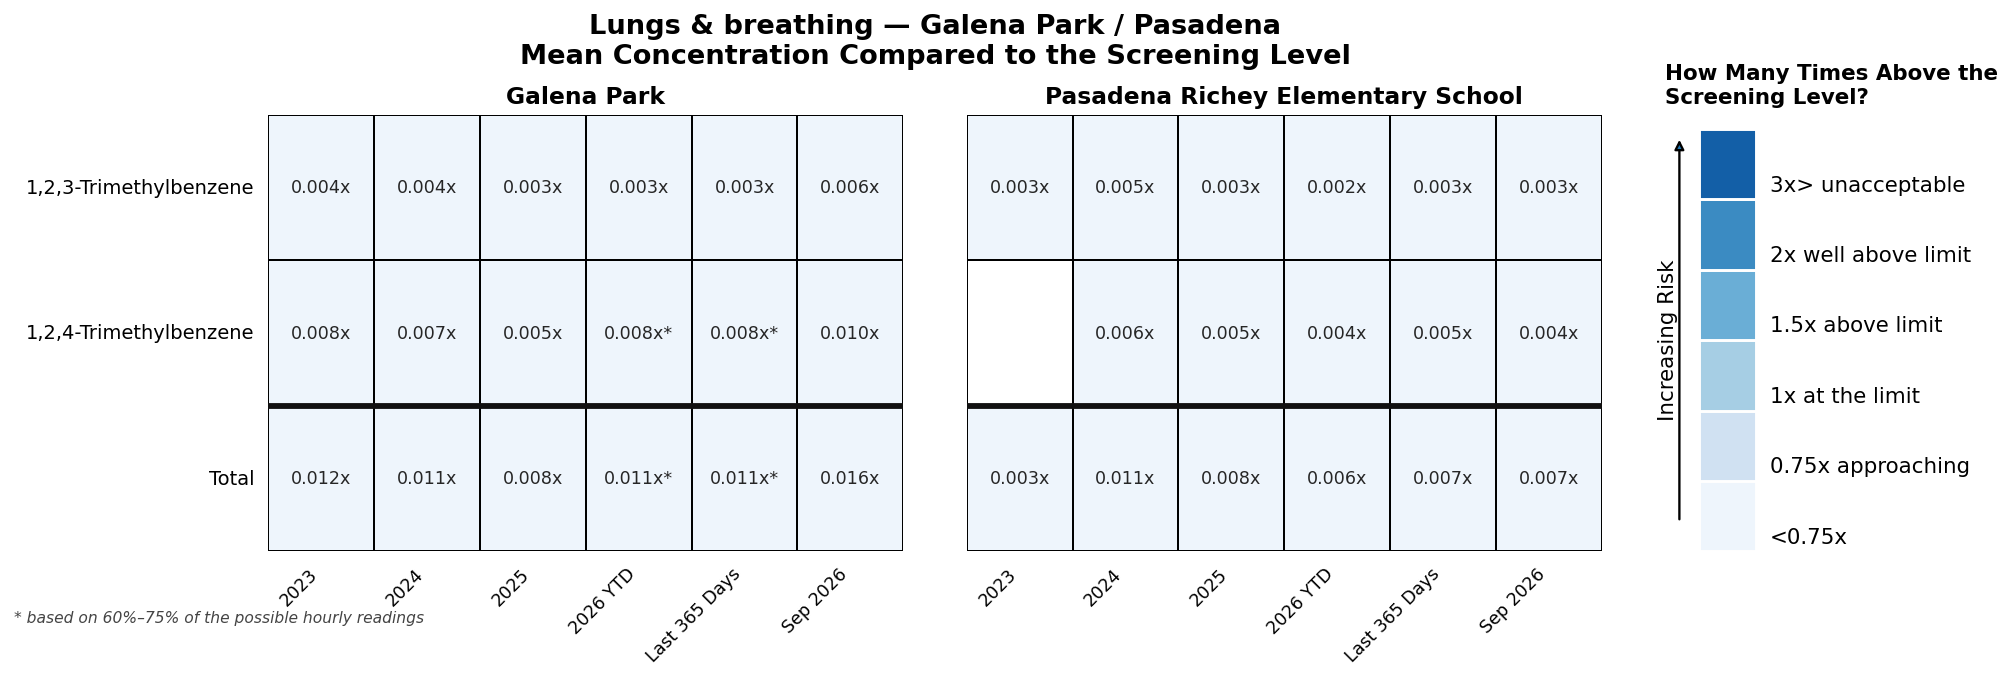
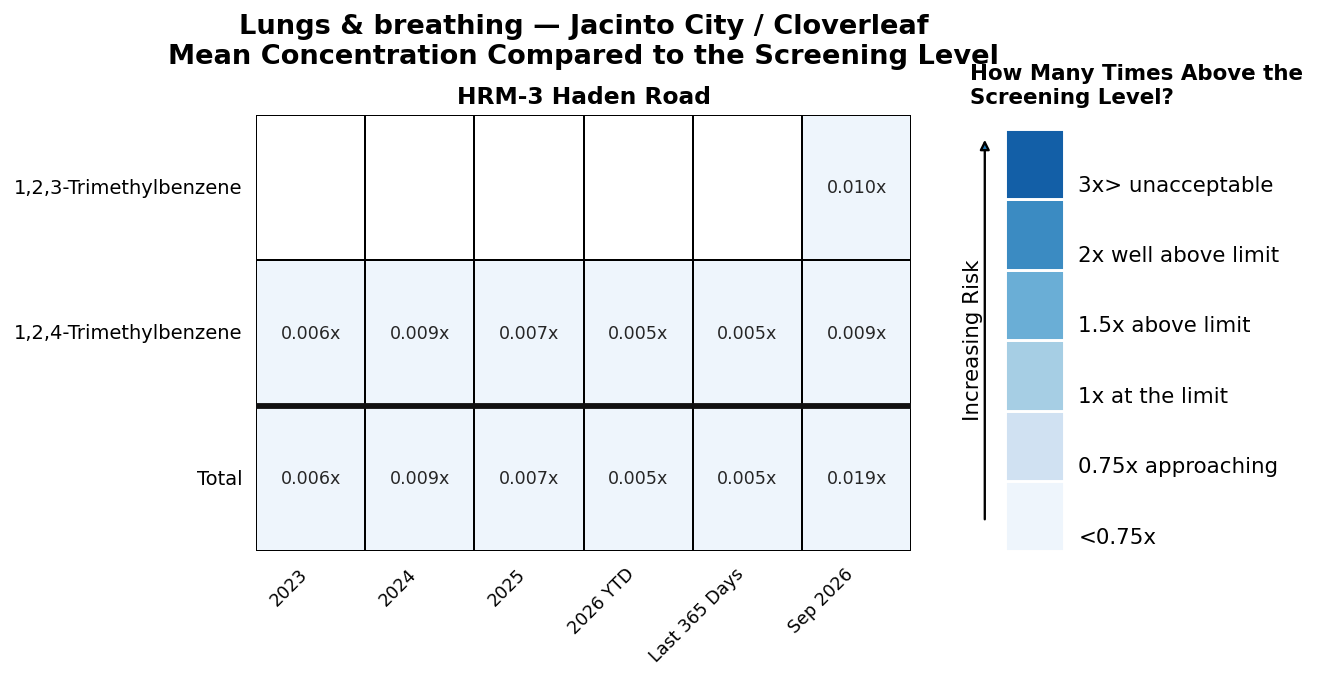
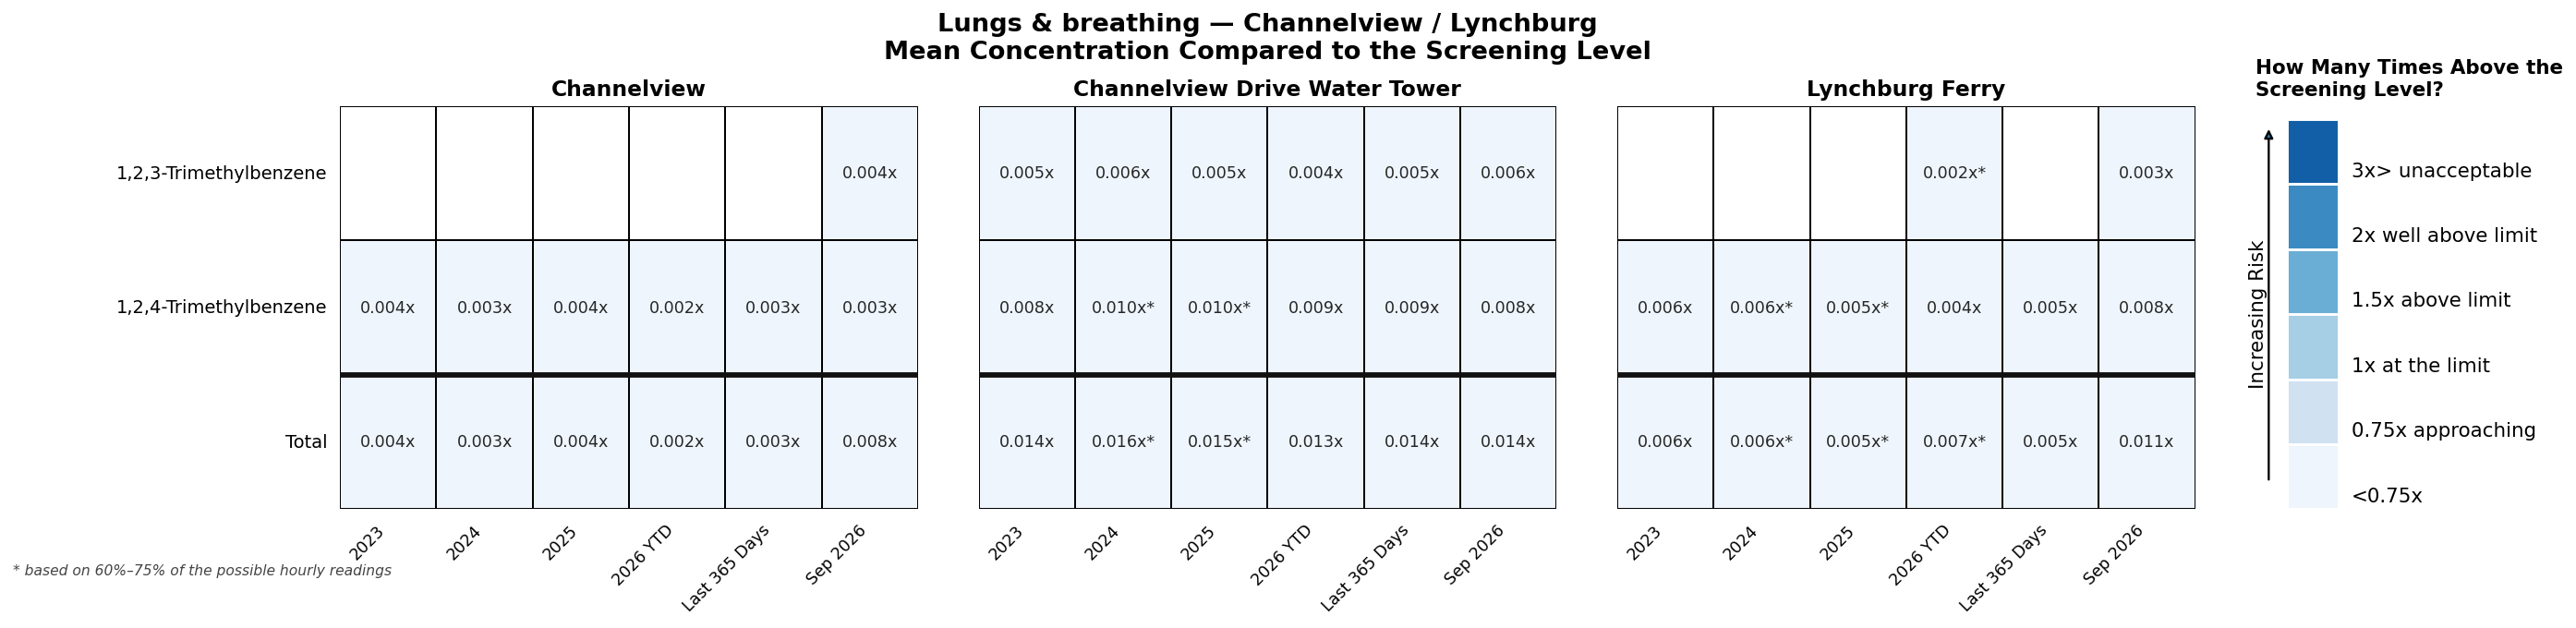
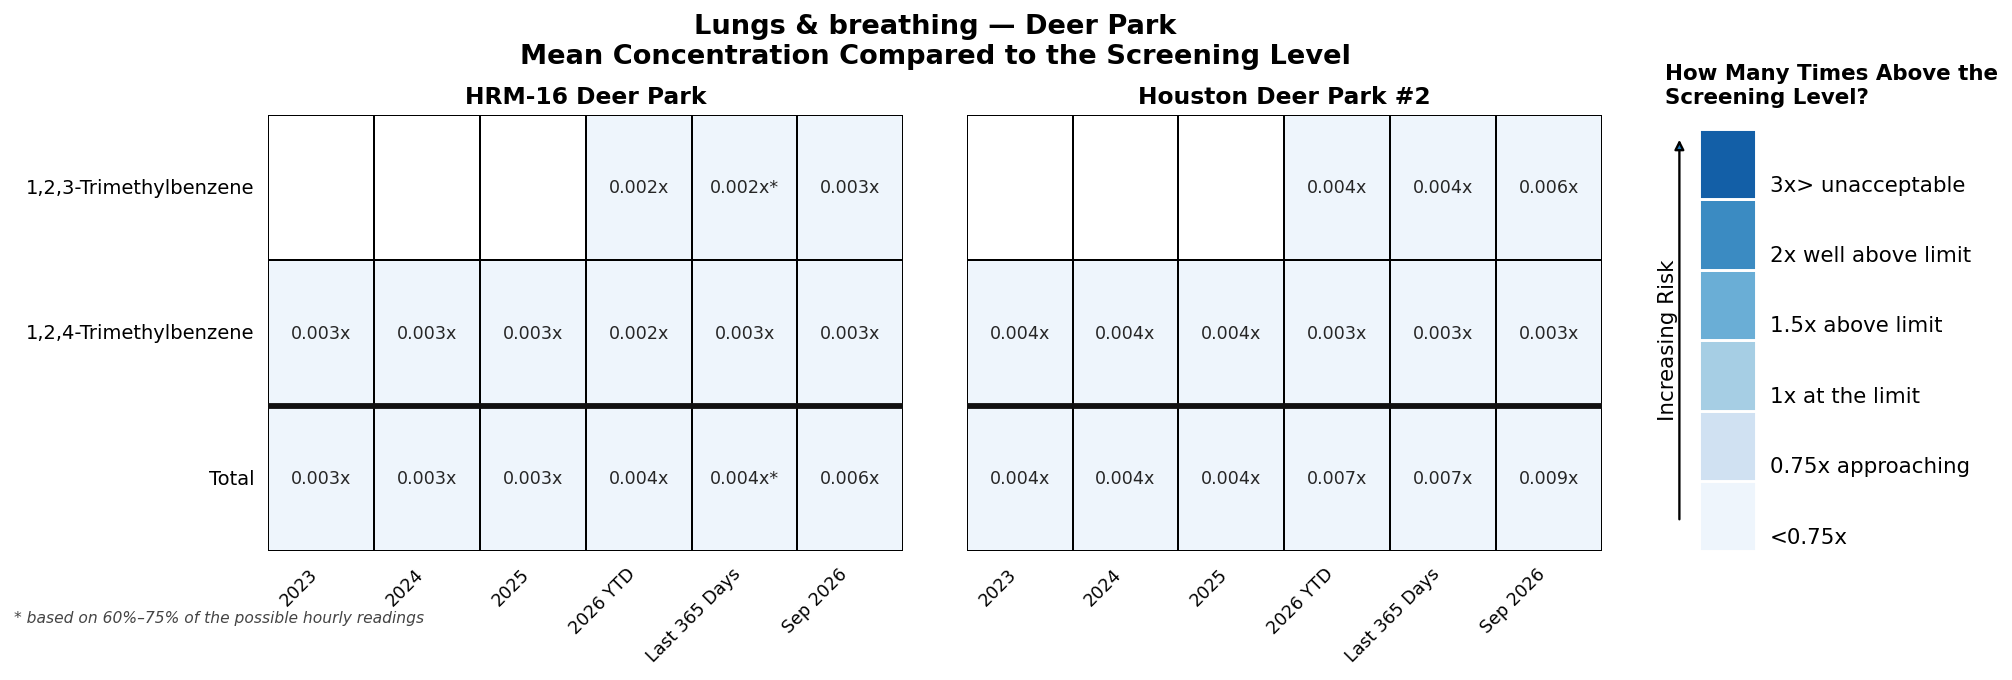
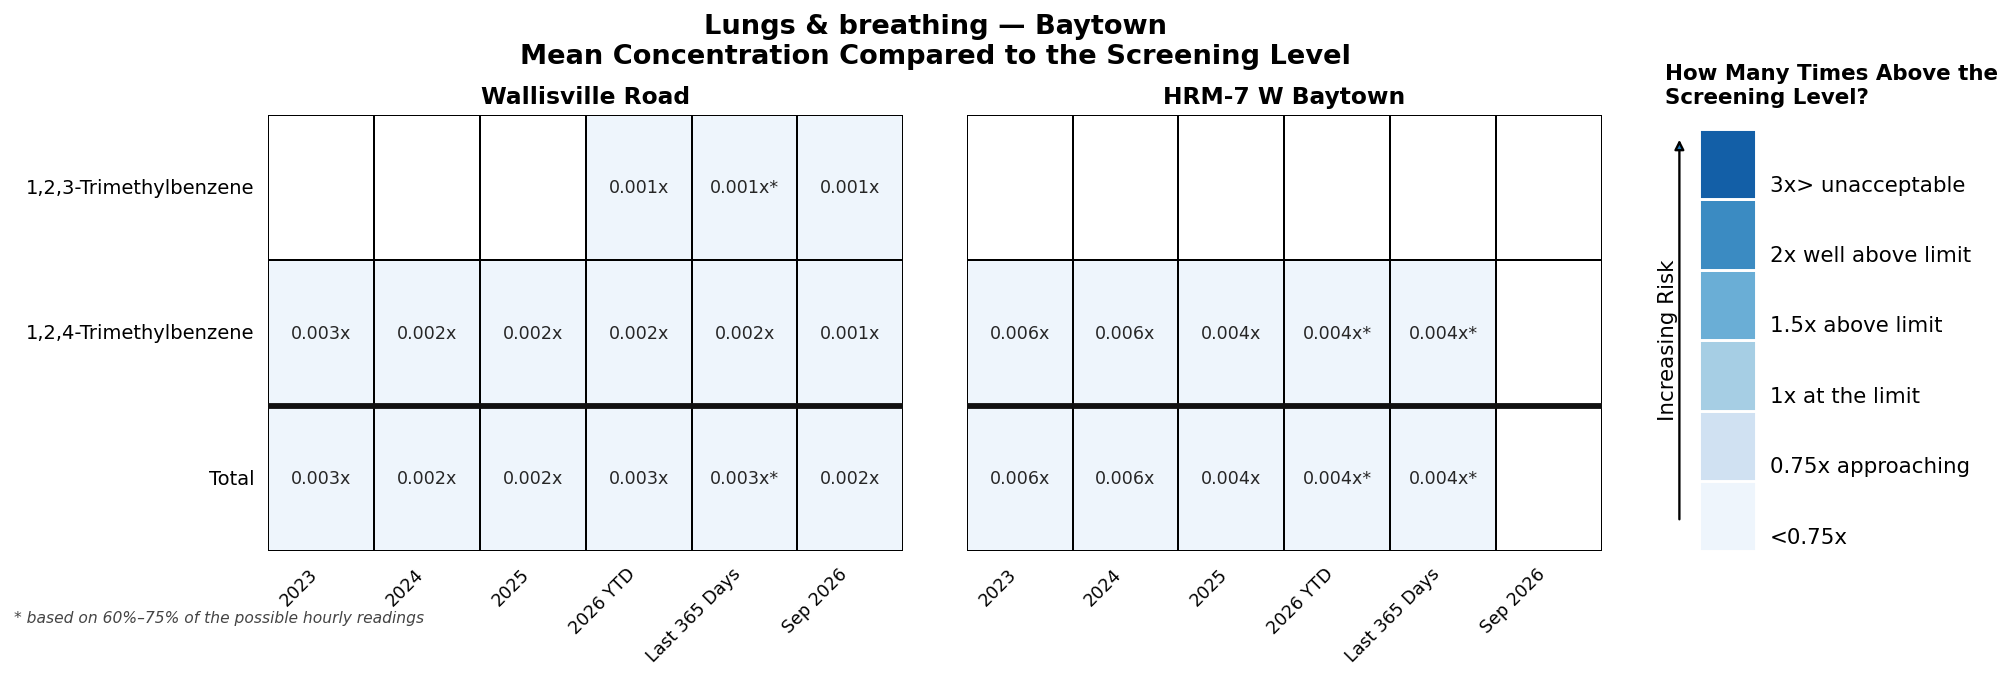
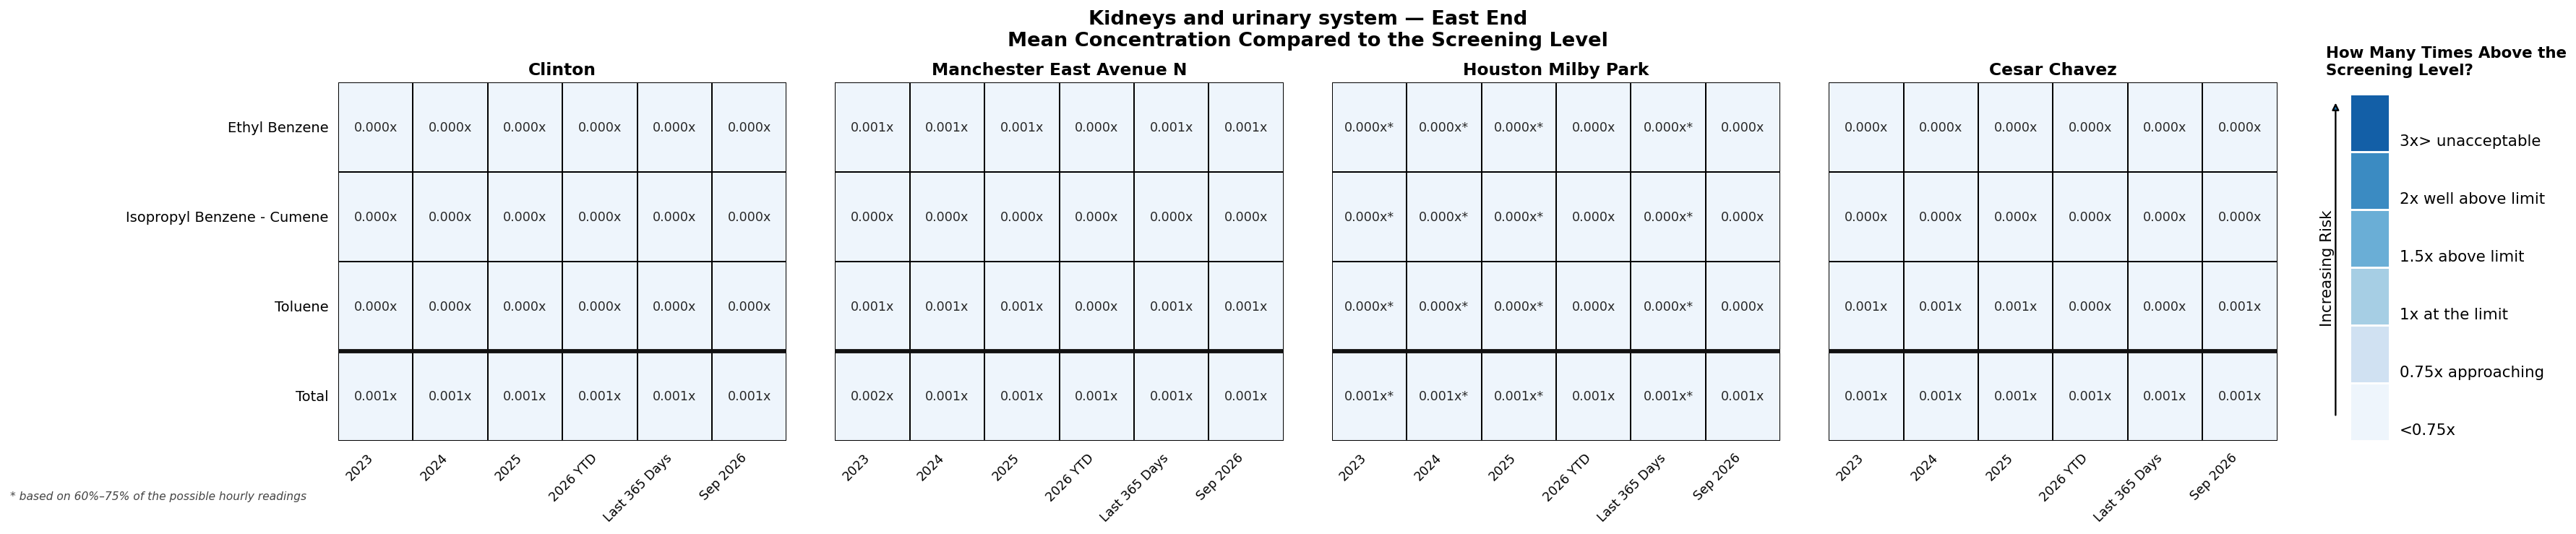
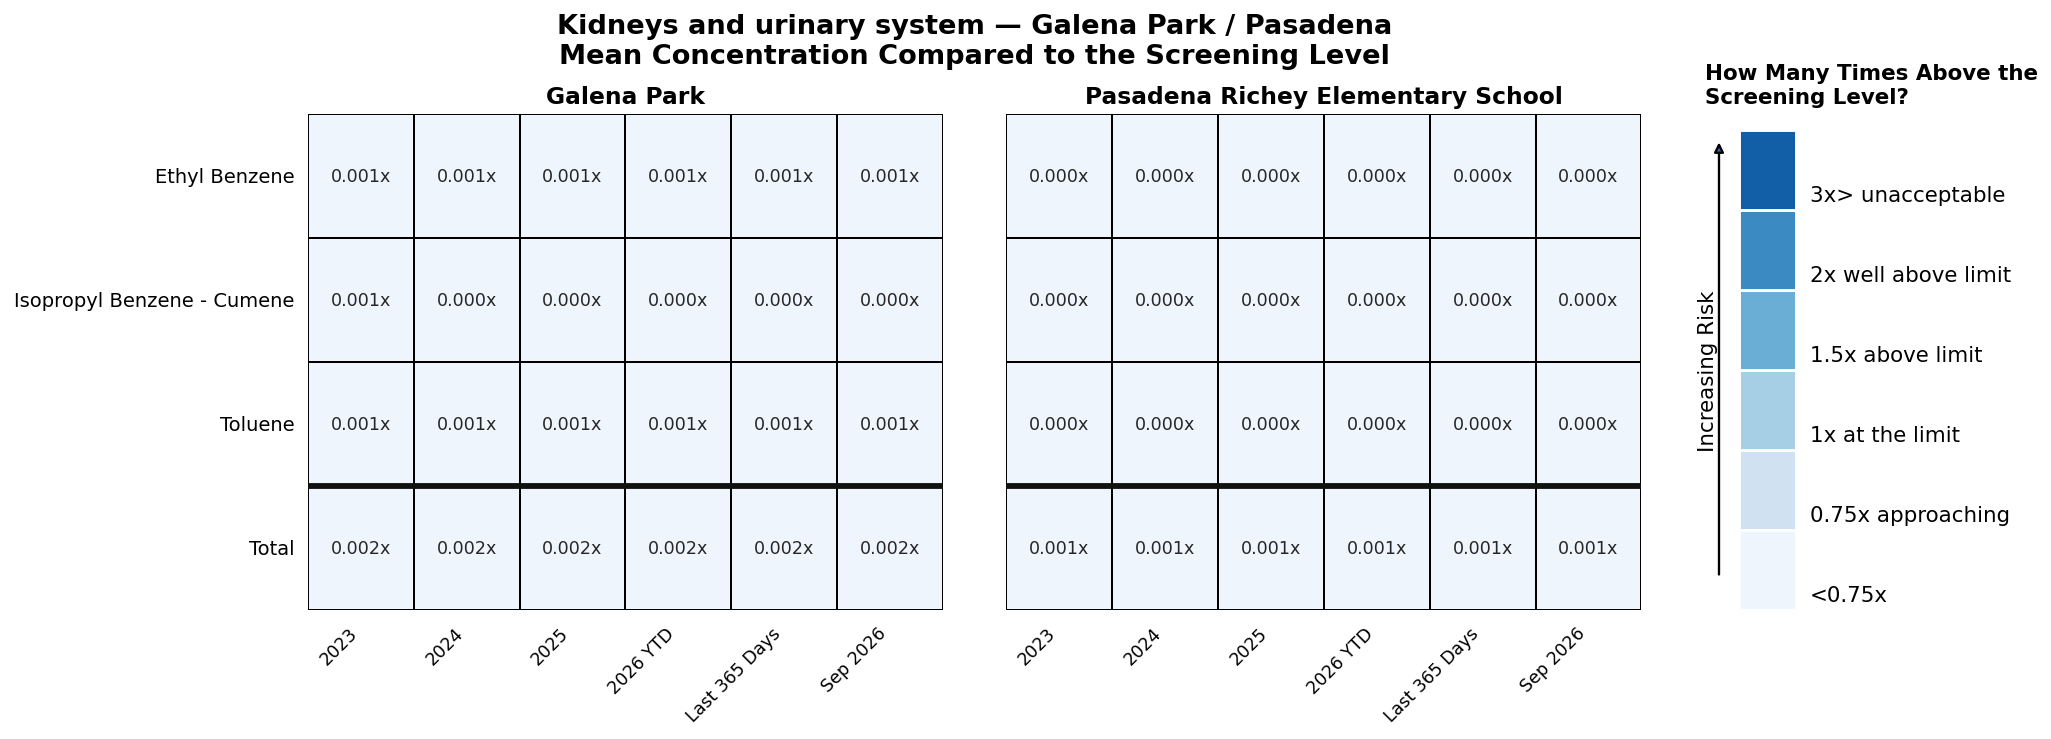
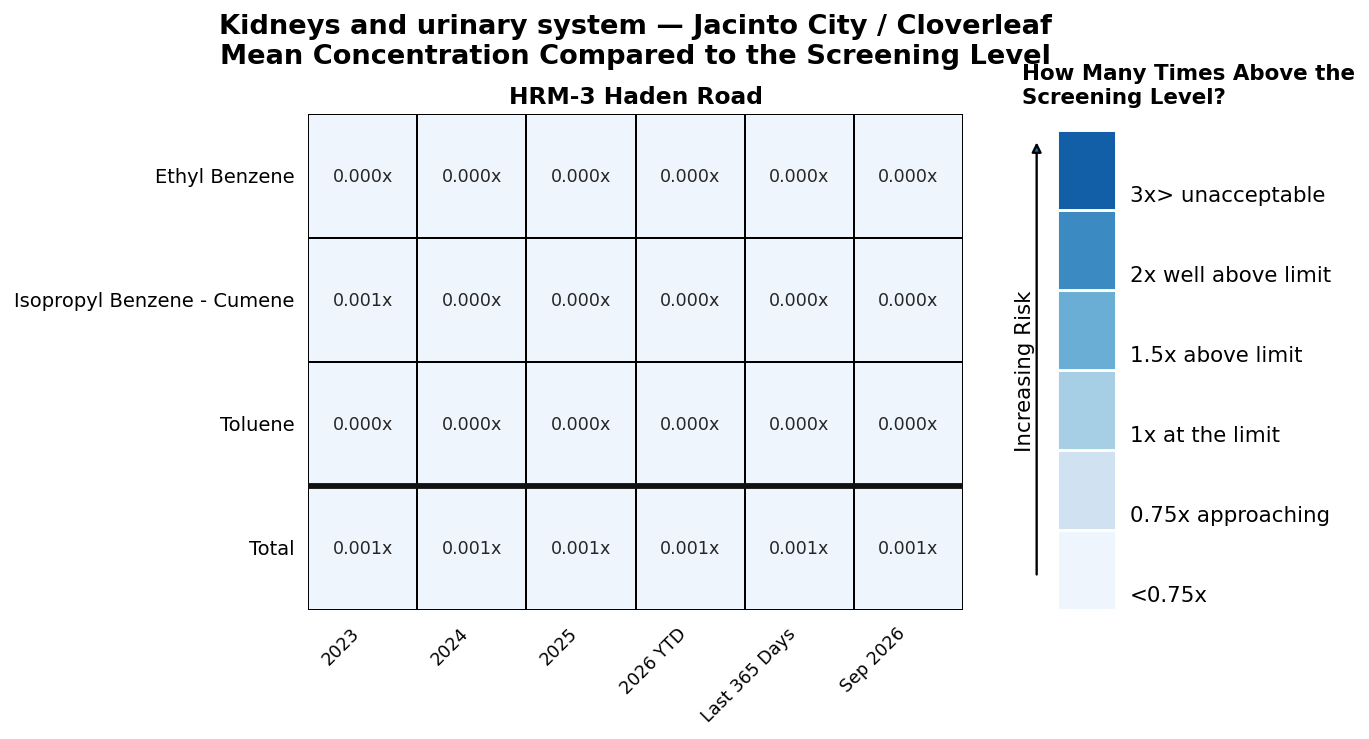
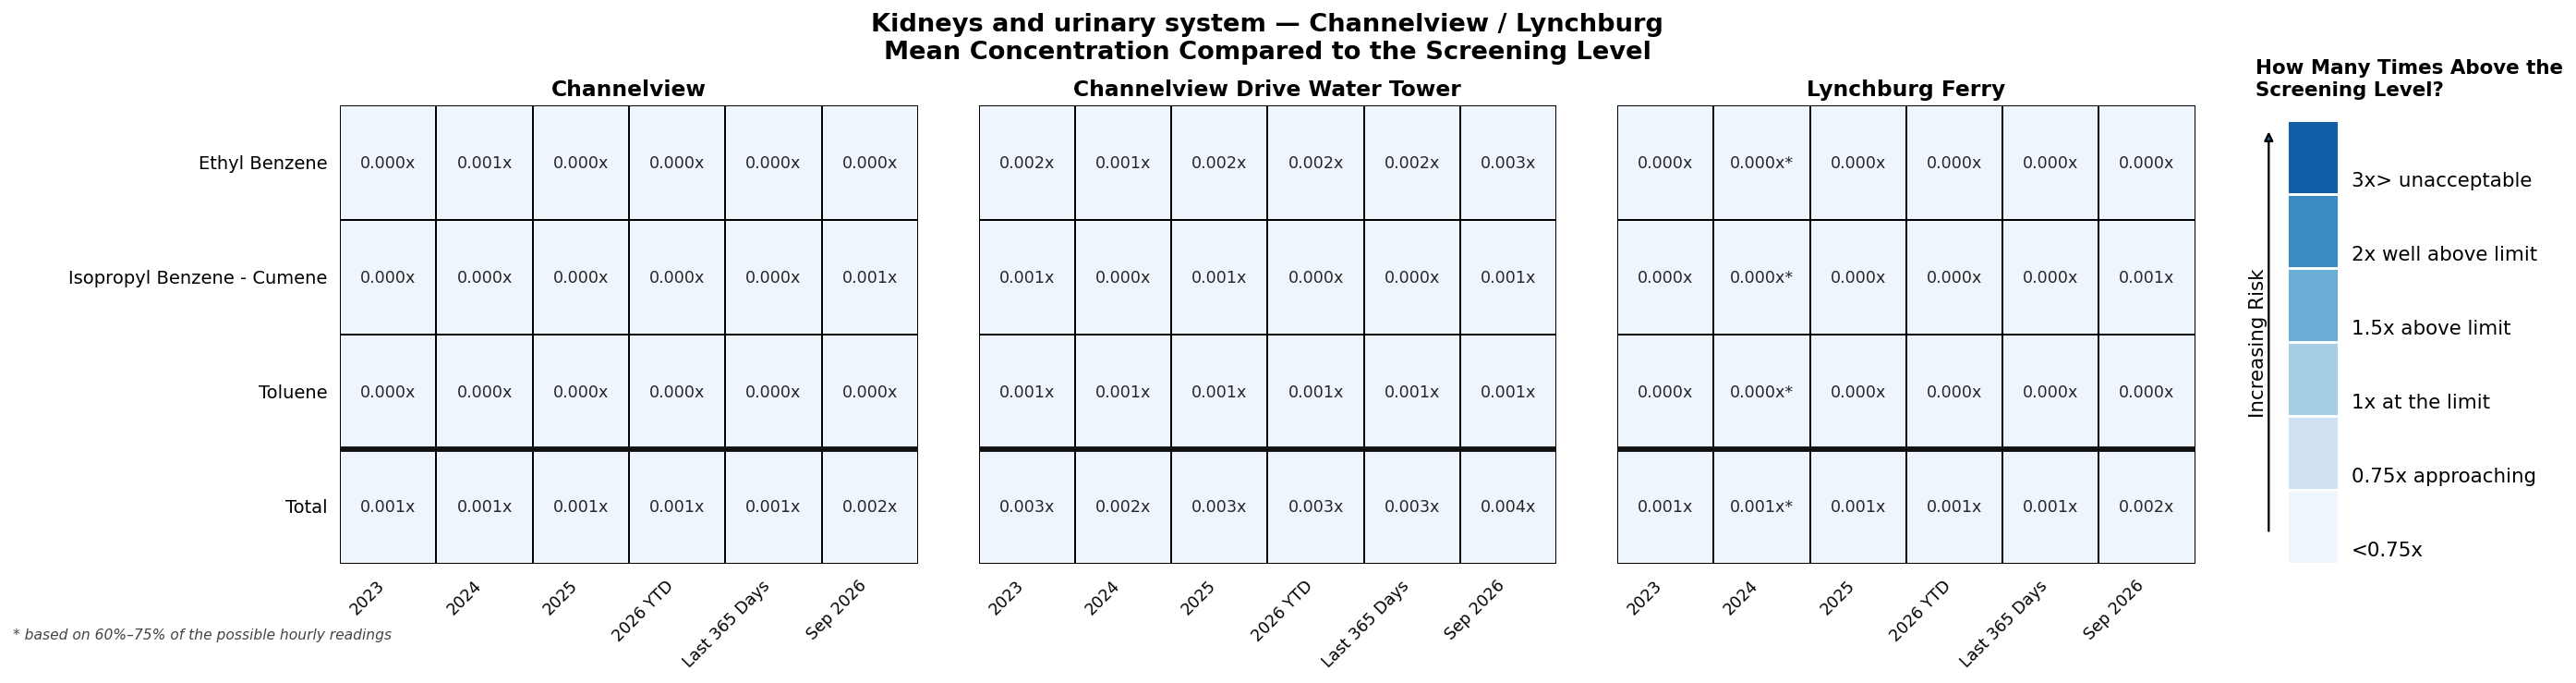
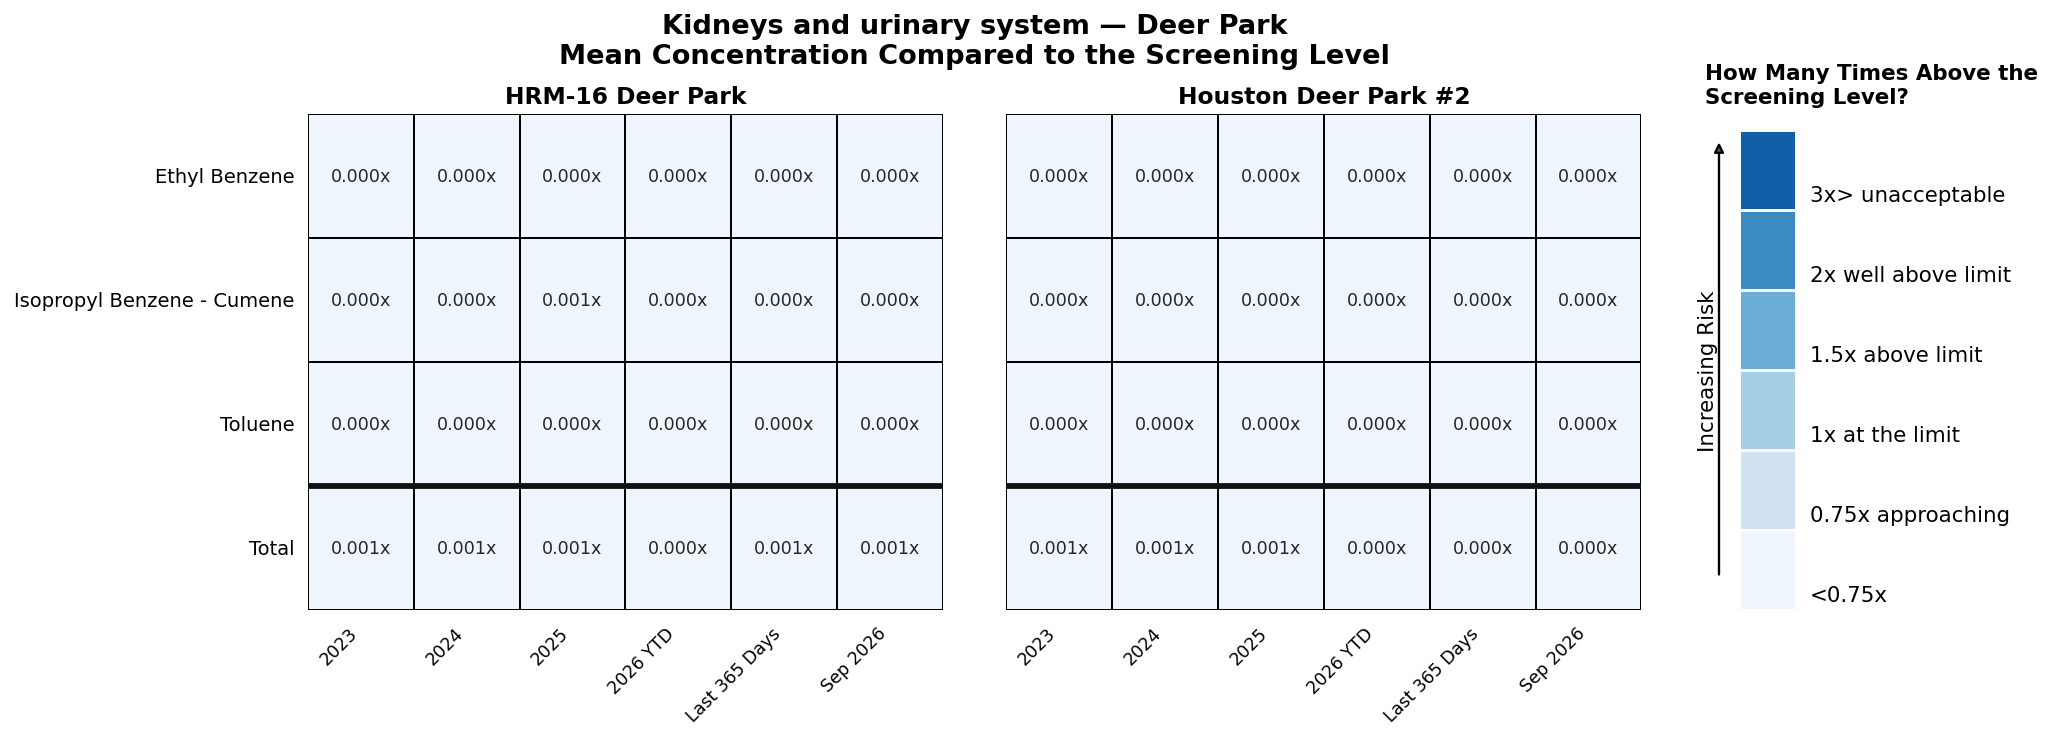
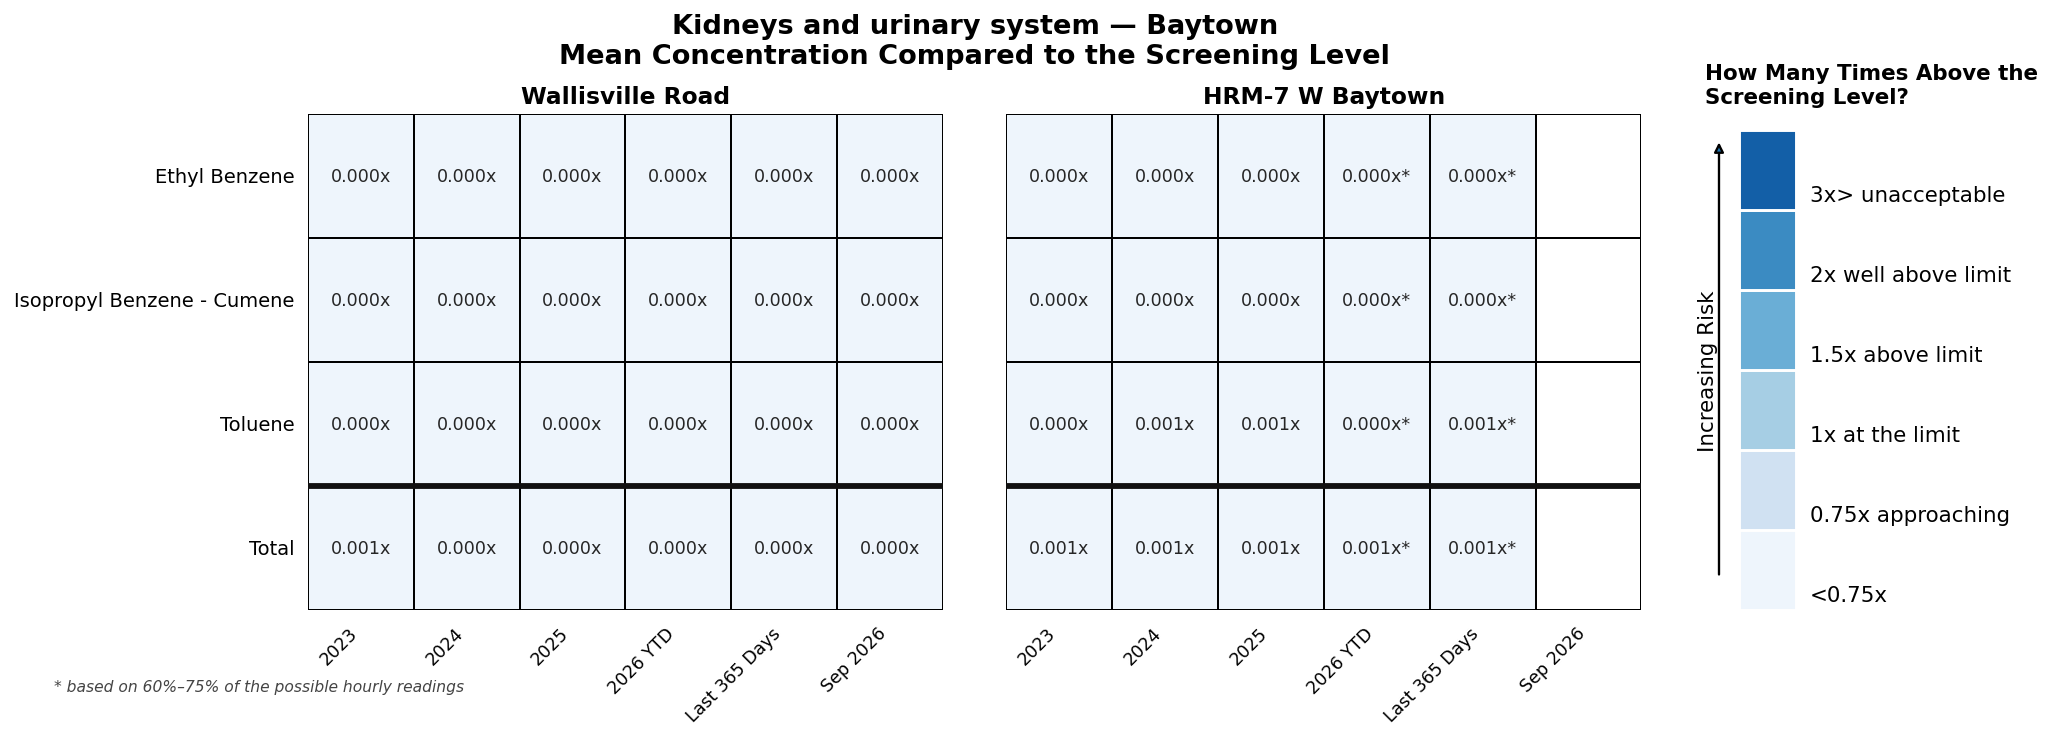
This view organizes the other health risk pollutants by health indicator — the body system that a pollutant can harm. Each plot below covers one indicator and shows every pollutant that contributes to it, with the monitors of one map section side by side and a Total row combining them. Each health indicator below is a tabbed card with one tab per section.
Each cell is the average level divided by the screening level for that pollutant. A value below 1.00x is below the screening level. A pollutant appears under every indicator it affects, so the same chemical can show up in more than one plot.
CHATTER analyzes air pollutants measured with automatic gas chromatograph (AutoGC) equipment. In Houston, CHATTER follows all fourteen hourly AutoGC monitors in Harris County — Clinton, Manchester East Avenue N, Houston Milby Park and Cesar Chavez (East End); Galena Park and Pasadena Richey Elementary School (Galena Park / Pasadena); HRM-3 Haden Road (Jacinto City / Cloverleaf); Channelview, Channelview Drive Water Tower and Lynchburg Ferry (Channelview / Lynchburg); HRM-16 Deer Park and Houston Deer Park #2 (Deer Park); and Wallisville Road and HRM-7 W Baytown (Baytown) — grouped into the six sections of the monitor map.
How to read this plot (click to expand)
Each plot is one health indicator — a body system such as the brain and nervous system or immune system. Within a plot, each row is a pollutant that can affect that body system, each column is a period of time, and the blocks side by side are the monitors of one map section; the tabs above the plot switch between sections. The bottom Total row adds the pollutants together.
The number in each square is the pollutant level divided by the screening level, written as a multiple with an “x.”
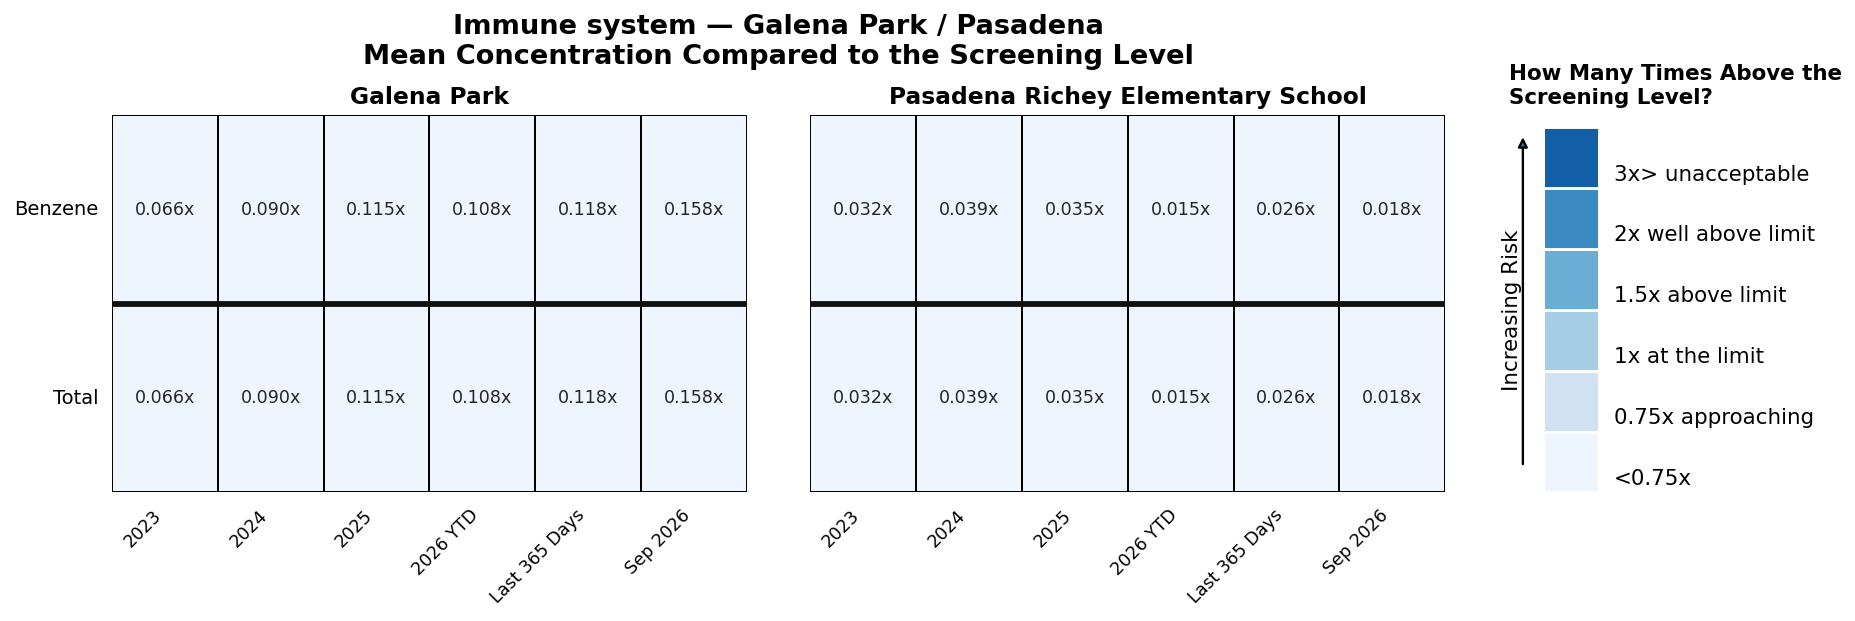
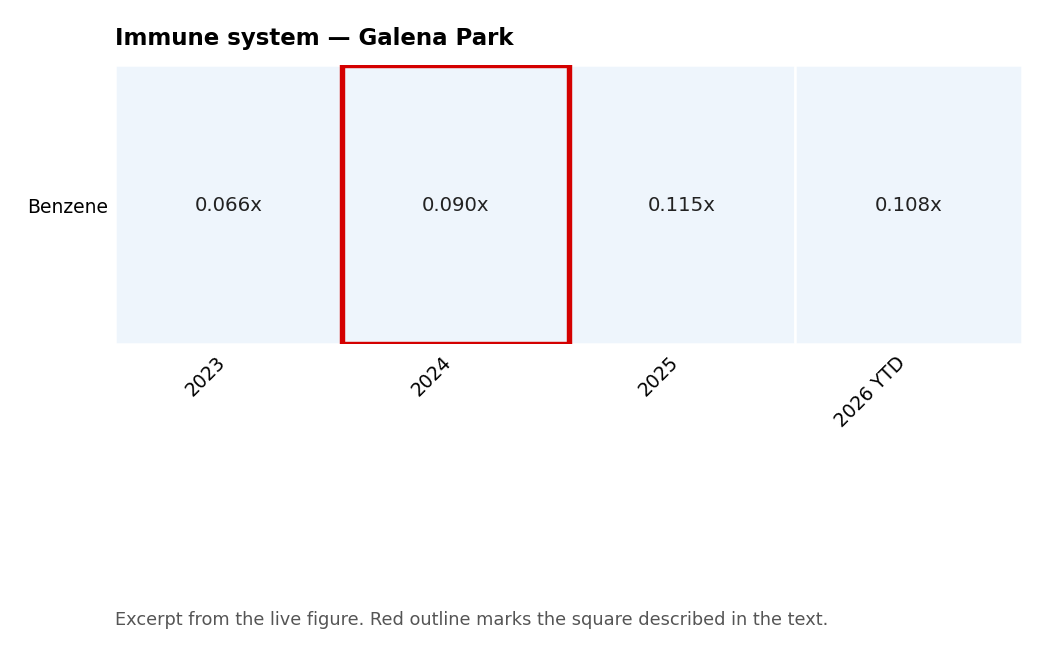
A clarifying example.In the Immune system plot, choose the Galena Park / Pasadena tab and find Benzene at Galena Park in 2024. The square reads 0.090x — the average benzene level was about 9% of the screening level, well below it. Because benzene is the only pollutant listed under Immune system, the Total row reads the same.
Most of this tab is below the screening level. The color scale does not begin to darken until 0.75x, and almost no value comes close, so the grids appear in the palest shade. The exception is the Ability to have children (reproductive) plot, where 1,3-butadiene at Houston Milby Park (East End tab) exceeds the screening level in several periods.
For the general explanation of heat maps, see the Frequently Asked Questions.